 Global| Oct 16 2006
German Productivity Growth in Manufacturing Tops That of the United States
Summary
Growth in productivity together growth in the labor force largely determines a country's potential growth rate. Recent trends in German productivity, especially in industry, suggest that the recent increase in Germany's growth rate [...]

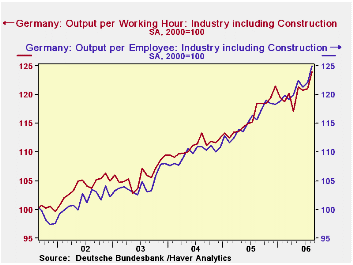
Growth in productivity together growth in the labor force largely determines a country's potential growth rate. Recent trends in German productivity, especially in industry, suggest that the recent increase in Germany's growth rate has solid underpinnings. Productivity in German Industry, as measured by output per employee, increased by 2.4% in August from July and was 8.0% above August, 2005. The comparable figures for productivity as measured by output per working hour are 2.5% and 11.6% respectively. The two measures differ from month to month but show the same general trends, as can be seen in the first chart. 
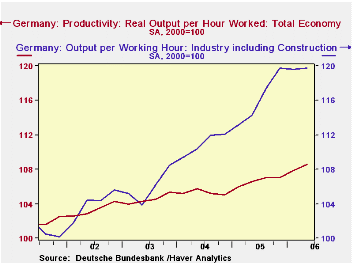
Germany also reports productivity data in more detail on a quarterly basis. Data are currently available only through the second quarter. Productivity for the total economy in the quarterly series is much lower than that of the productivity in industry in the monthly series, as can be seen in the second chart. Part of the difference in the two series is due to the fact that agriculture and public and personal service, both with low productivity are included in the quarterly series but not in the monthly series.
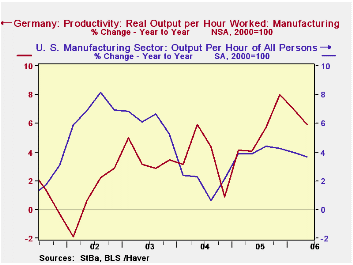
The growth in productivity in the manufacturing industry in Germany is now above that of the United States, as can be seen in the third chart. Moreover, when both indexes are compared on a common base year--2000--the current level of the German index is higher than that of the U. S.--meaning that the level of manufacturing productivity in Germany has now risen more than that of the U. S. since 2000.
| PRODUCTIVITY (2000=100) | Q2 06 | Q1 06 | Q2 05 | Q/Q % | Y/Y % | 2005 % | 2004 % | 2003 % |
|---|---|---|---|---|---|---|---|---|
| Manufacturing | ||||||||
| Germany | 131.25 | 117.29 | 123.94 | 11.94 | 5.93 | 5.47 | 3.59 | 3.58 |
| United States | 126.35 | 125.53 | 121.86 | 0.65 | 3.69 | 4.10 | 18.5 | 6.21 |
| Total Economy | ||||||||
| Quarterly Series | 108.55 | 107.80 | 106.52 | 0.66 | 1.91 | 1.32 | 0.69 | 1.21 |
| Monthly Series (Aggregated on a qtrly basis) |
119.7 | 119.6 | 114.3 | 0.11 | 4.78 | 4.68 | 4.72 | 1.83 |
| Monthly Series Total Economy | Aug 06 | Jul 06 | Aug 05 | M/M % | Y/Y % | 2005 % | 2004 % | 2003 % |
| Output per employee | 125.0 | 122.1 | 115.7 | 2.38 | 8.04 | 5.05 | 5.13 | 2.78 |
| Output per working hour | 124.0 | 121.0 | 118.5 | 2.48 | 4.64 | 4.68 | 4.72 | 1.83 |


