 Global| May 09 2011
German Trade in Goods Improves in March in spite of Rising Euro
Summary
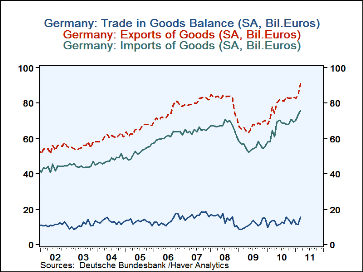
Germany's exports of goods rose 7.3% from 84.7 billion euros in February to 90.9 billion euros in March. The rise in imports was smaller, 3.0% from 73.46 billion euros to 75.7 billion euros in March, resulting in an increase of 3.96 [...]
 Germany's exports of goods rose 7.3% from 84.7 billion euros in February to 90.9 billion euros in March. The rise in imports was
smaller, 3.0% from 73.46 billion euros to 75.7 billion euros in March, resulting in an increase of 3.96 billion euros in the trade balance
from 11.3 billion euros in February to 15.2 billion euros in March. Exports, imports and the balance on trade in goods are shown in the first
chart.
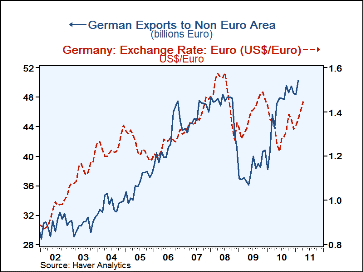
The rise in exports has taken place in spite of a rising euro. It should be noted that Germany's exports to other Euro Area countries are, of course, not affected by changes in the value of the Euro and these countries currently account for about 40% of total exports Thus about 60% of German exports are affected by changes in the value of the euro. In the second chart we have plotted the exchange rate, US$ per Euro, and the amount of exports to countries other than those in the Euro Area. It appears that the rise in the euro has had little effect on the recent trend in these exports. The latest date for these data is February. Given the improvement in total exports in March, it is fair to say that this trend has continued into March.
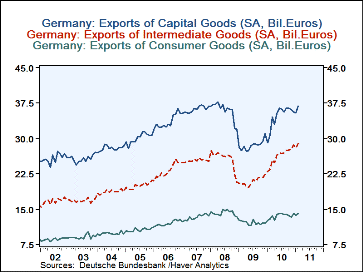
The latest date for data on the composition of exports by broad categories is also February. The third chart shows exports for intermediate goods, consumer goods and capital goods. All three increased in February and, given the rise in total exports, are likely to have continued to rise in March.
| German Trade in Goods (billions of euros) | Mar11 | Feb11 | Mar 10 | M/M% | Y/Y% | 2010 | 2009 | 2008 |
|---|---|---|---|---|---|---|---|---|
| Exports | 90.96 | 75.72 | 77.88 | 7.34 | 16.80 | 946.76 | 801.66 | 981.60 |
| Imports | 75.72 | 73.46 | 64.53 | 3.08 | 13.34 | 794.94 | 663.89 | 805.05 |
| Balance | 15.24 | 11.28 | 13.35 | 3.96* | 1.89* | 151.85 | 137.79 | 176.61 |
| Feb'11 | Jan'11 | Dec'10 | Nov'10 | Oct'10 | Sep'10 | Aug'10 | Jul'10 | |
| Exports to Non Euro Area Countries | 50.29 | 48.42 | 48.70 | 49.46 | 48.50 | 49.56 | 47.71 | 47.81 |
| * Amount in billions of Euros | ||||||||


