 Global| Oct 05 2017
Global Services Sector Shows Growth But Erratic Momentum
Summary
Globally, service sector metrics show continued growth. All countries/regions (hereafter, I will simply reference 'countries' with no change in meaning) show service sector diffusion readings above 50, indicating expansion. I evaluate [...]
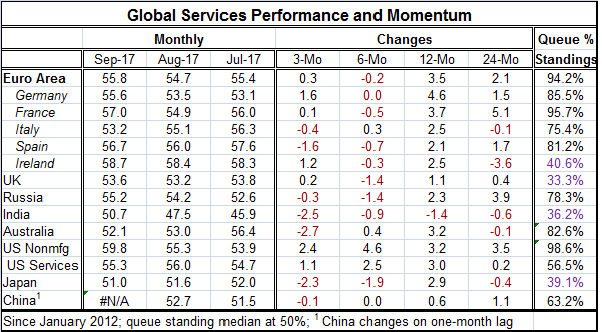
 Globally, service sector metrics show continued growth. All countries/regions (hereafter, I will simply reference 'countries' with no change in meaning) show service sector diffusion readings above 50, indicating expansion. I evaluate China in this discussion by referring to its August value and to the September values for all other countries. I count the U.S. twice, once for its services reading and once for nonmanufacturing. And while I find that growth is present everywhere, momentum is a different matter.
Momentum over various horizons
Over three months of the 14 observations, seven show declines. Momentum is improving for half this sample and declining for the other half. And there is a split in momentum among the largest economies, with both U.S. measures rising and the EMU measure rising, but with China and Japan showing setbacks, among others. Another theme here is how much Asia lacks momentum.
Over six months, 10 of 14 show either momentum drops or unchanged momentum (two are unchanged). The two U.S. measures show substantial increases along-side minor gains by Italy and Australia. Elsewhere services gauges are either flat or lower compared to six months ago.
Over 12 months, the service diffusion indexes rise in all countries except India.
Over 24 months, five countries show service sector readings that are lower in September than they were two years ago.
Issues in momentum
I hope that these are eye-opening readings. The manufacturing gauges get most of the sunlight and partly is because there are more of them. These service sector readings underscore the sense that the global expansion may not be faring as well as many think. While services diffusion metrics show growth is still the operative condition, growth is also slowing from what it was on some rather broad and important fronts The rebounds in manufacturing are not infusing services with a new vigor or at least not yet. Recent sharp (likely hurricane-related) gains in the U.S. for its nonmanufacturing ISM notwithstanding, the global economy is not showing its services sector in a very robust light. More troublesome is that China, a country supposed to be shifting over to a more service sector oriented economy, shows no sign of doing that. If it were doing that, its services sector should persistently expand more broadly and that is not happening.
The queue standings
Six of the regions have queue standings for their service sector PMIs that are in the top 20th percentile of all readings since January 2012 (queue percentile standings). Yet, many PMI readings are still low and then there is the momentum question. Four countries show PMI readings below their respective medians for this period (Ireland, the U.K., India, and Japan). Oddly, the U.S. services reading has only a 56th percentile standing while its nonmanufacturing reading has a 98.6 percentile standing. That is quite different for two surveys with so much common coverage (all of services but for the nonmanufacturing gauge also construction and mining).
Shifting sands of economic leadership
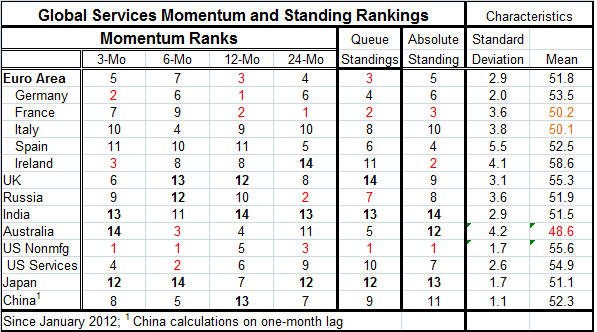
The second table below creates some analytical information to help understand services trends. I rank each services sector's raw diffusion score on changes across the horizons in the table. What we see there is some considerable changes in leadership and laggard-ship across countries on the various horizons. Because of its recent surge, the U.S. nonmanufacturing ISM index is strong, if not a top 3 rank on all horizons. The U.S. service sector gauge, however, is migratory in its ranking over time. Germany also has consistently top tier sort of scores. Japan, India and the U.K. each have consistently weak scores. Italy and Spain are laggards, with one exception each. China tends to be in the bottom half of the rankings as does Russia, with one exception.
Strong regions still harbor variation
In the EMU, the overall ranking score for momentum is a near top tier score consistently. But within the EMU, it is Germany and France that are performing while Spain and Italy are laggards and Ireland is mostly a laggard.
As for the queue standings ranked across regions, they generally favor the U.S. and the euro area where France actually has a better queue standing than the EMU itself. Japan, Italy and the U.K. are laggards and the U.S. is split between being a leader and laggard on its two measures.
Volatility
Ranked by volatility, Spain has been the most volatile services sector since January 2012, followed by Australia and Ireland...then by Italy and Russia. Low volatility readings come from China, Japan, the U.S. (nonmanufacturing), Germany, U.S. services and the euro area, in that order.
China's low volatility is a bad sign and makes me (at least) wonder about the veracity of its data. Actual data simply move around a lot more than most people expect. Data that are highly estimated are much smoother because models will not project the same sort of volatility we see in real world data. Seeing China with the most quiescent services sector by far does not reassure me on the veracity of its readings.
Rankings compared queue method vs. raw (absolute) readings
Next we compare the ranking on the queue standings to the absolute diffusion standings in September. The correlation been these two gauges is 0.58 while the R-squared relationship is 0.34. One can explain only about one third of the variation of the other. In raw score (absolute standing), your top four services sectors are U.S. (nonmanufacturing), Ireland, France and Spain. On a queue basis (queue standings), they are U.S. (nonmanufacturing), France, the EMU and Germany. The weakest countries on a raw score are India, Japan Australia and China. On a queue standing, the four weakest are the U.K., India, Japan and Ireland. Ireland is a real fly in the ointment wanting to score as a top four sector on one gauge and as a bottom four sector on the other.
I prefer the queue standing rankings because they discount each country for its average tendency. Some countries simply tend to have higher diffusion than others and that robs the level of some of its meaning. Secondly, since diffusion is really only a measure of breadth and we wish to use this as a gauge of strength, taking a gauge that weighs momentum and past history more makes sense. It is the current level relative to history that has more information in it than just the raw level of the reading. If you look at the components of the services sector (or of any PMI gauge), you will immediately find that this is true. Some components vary over very narrow ranges while others have broad ranges. It is quite clear that to evaluate the components and compare their performance to one-another you need to account for these differences in volatility and range in some way.
Finally, we compare the queue standing rankings to the ranking of countries by their mean values from January 2012 to date. On this score, we find that September queue value's correlation with the rank of the mean to be -0.13 or 0.02 in R-square terms - exceptionally low. The queue ranking is independent of the level of the mean for the period, and that is a good thing. However, the absolute standing ranking correlates to the mean ranking with a correlation of 0.56 and an R-square of 0.31. The average level of the diffusion index explains about one third of the ranking by level in September. From these correlations, we see that the queue standing does its job. It arrays rankings according to relative historic strength. If we are more interested in assessing momentum than average tendencies, the queue metric standings are better gauges.
Services sectors are still lacking
On balance, these diagnostics on the global services sector show us a great deal of variation is in play. While growth remains the rule of this broad jobs-generating sector, on the metric of momentum there is less room for satisfaction. There are still a lot of uneven patches in the global economy. And China's enormous services sector is still hitting the slumber button on its alarm clock. China needs to make the transition to being more of a services economy and it simply is not doing that.

Robert Brusca
AuthorMore in Author Profile »Robert A. Brusca is Chief Economist of Fact and Opinion Economics, a consulting firm he founded in Manhattan. He has been an economist on Wall Street for over 25 years. He has visited central banking and large institutional clients in over 30 countries in his career as an economist. Mr. Brusca was a Divisional Research Chief at the Federal Reserve Bank of NY (Chief of the International Financial markets Division), a Fed Watcher at Irving Trust and Chief Economist at Nikko Securities International. He is widely quoted and appears in various media. Mr. Brusca holds an MA and Ph.D. in economics from Michigan State University and a BA in Economics from the University of Michigan. His research pursues his strong interests in non aligned policy economics as well as international economics. FAO Economics’ research targets investors to assist them in making better investment decisions in stocks, bonds and in a variety of international assets. The company does not manage money and has no conflicts in giving economic advice.
More Economy in Brief


