 Global| Aug 01 2007
Greater Risk Evident in (1) More Stock Options Volatility, (2) Wider Yield Spreads and (3) Sluggish House Prices
Summary
Today, August 1st, as we write at mid-afternoon, the stock market is hovering near yesterday's close, following its up-and-down lurches of recent days, as investors have been factoring more risk into their portfolios. In this note, we [...]

Today, August 1st, as we write at mid-afternoon, the stock market is hovering near yesterday's close, following its up-and-down lurches of recent days, as investors have been factoring more risk into their portfolios. In this note, we highlight a couple of indicators of risk that are available in Haver databases and a piece of new economic data pertinent to the current troubles.
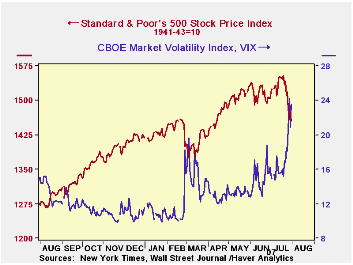
Yesterday's 1.3% decline in the S&P 500 index was the fifth daily fall in eight trading days since the July 19 all-time high close of 1,553.08 (and 14,000.41 in the Dow). It almost goes without saying that the day-to-day movements have been noticeably more volatile. One indication of this is that during June, the market drifted lower from the beginning of the month to the end. But it then reversed to set new highs just after mid-July and reversed again to show a decline of 3.2% for July as a whole and 6.3% from July 19 to month-end. Press reports have noted the greater volatility and called our attention to the "VIX" index, a measure based on the behavior of put-and-call options on the Standard & Poor's 500 stocks. VIX, the ticker symbol for "Volatility Index", is calculated from options prices on the Chicago Board Options Exchange, CBOE, and can be traded on its own without the complications of the actual options features. Daily changes in the VIX have an 87% negative correlation with daily movements in the S&P 500 index. This index, along with other indicators of options trading, is in Haver's DAILY database, and is seen in the first graph here. From an average just under 15 in June, the VIX reached 23.52 yesterday.
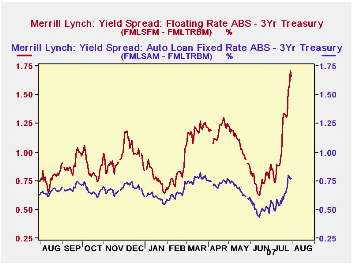
Also in DAILY, we carry a collection of Merrill Lynch fixed income yields. These are handy because they cover many sectors of the bond market and are calculated in standard ways, so they are all comparable with each other. Part of the markets' distress relates to the rise in short-term interest rates and the impact they have on instruments carrying adjustable rates. The Merrill yields include the class of asset-backed securities (ABS) that have floating rates, and we can compare that with a risk-free fixed Treasury rate of roughly the same maturity. The credit quality of the ABS "floaters" is not low; they differ from ordinary ABS's only in their floating- rate feature. But we can see in the second graph that their spread to Treasury's has widened sharply in just the last few weeks. While the spread of a fixed-rate ABS has also widened, the increment is much smaller.
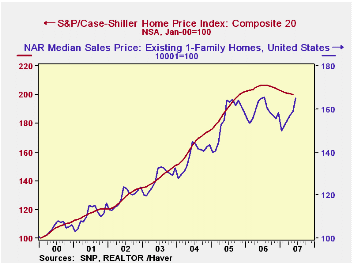
Finally, yesterday, S&P Case-Schiller reported its monthly house price index. This indicator of national home price movements edged down yet again in May, by 0.23% from April, a tenth consecutive monthly reduction. The Case-Schiller index has the advantage over other house price measures of using a collection of "repeat sales". The compilers canvass records of deeds, so their index is not a sample; it covers all house sale transactions in a particular area that meet certain specifications. The repeat-sales feature means the index is measuring price change in the same house, so it only reflects price change, not bigger vs. smaller houses, houses with pools vs. houses with no pool and so on. We can see in the last graph that despite an upturn in the median price of existing home sales compiled by the National Association of Realtors, the actual "price" of a given house has not yet started to improve. This is exactly the problem facing real estate markets generally at the present time: sellers can't get their price. This too adds risk to financial markets and we are seeing how widespread are the ramifications of this shortfall. The S&P Case-Schiller Index is in the USECON database and data for several cities appear in REGIONAL.
| July 31 | July 30 | July 27 | July 26 | July | June | Jan-May | |
|---|---|---|---|---|---|---|---|
| S&P 500* | 1455.27 | 1473.91 | 1458.95 | 1482.66 | 1520.70 | 1514.49 | 1450.14 |
| % Chg* | -1.3 | +1.0 | -1.6 | -2.3 | -3.2 | -1.8 | +1.5 |
| S&P VIX | 23.52 | 20.87 | 24.17 | 20.74 | 17.29 | 14.95 | 12.72 |
| Merrill Lynch Treasury: 3Yr | 4.546 | 4.555 | 4.522 | 4.522 | 4.823 | 4.992 | 4.675 |
| Merrill Lynch Asset-Backed Floater | 6.206 | 6.269 | 6.106 | 6.057 | 5.944 | 5.742 | 5.681 |
| Spread | 1.660 | 1.714 | 1.584 | 1.535 | 1.121 | 0.750 | 1.005 |
| May 2007 | Apr 2007 | Mar 2007 | May 2006 | 2006 | 2005 | 2004 | |
| S&P Case- Schiller Home Price Index** | 200.04 | 200.51 | 200.97 | 205.86 | 204.85 | 190.43 | 164.48 |
| -0.23 | -0.23 | -0.29 | -2.83 | +7.58 | +15.78 | +15.40 | |
| NAR Existing Home Median Price Index** | 159 | 159 | 155 | 164 | 159 | 156 | 138 |
| +1.2 | +1.4 | +1.8 | -2.9 | +2.0 | +12.8 | +8.1 |
Carol Stone, CBE
AuthorMore in Author Profile »Carol Stone, CBE came to Haver Analytics in 2003 following more than 35 years as a financial market economist at major Wall Street financial institutions, most especially Merrill Lynch and Nomura Securities. She had broad experience in analysis and forecasting of flow-of-funds accounts, the federal budget and Federal Reserve operations. At Nomura Securities, among other duties, she developed various indicator forecasting tools and edited a daily global publication produced in London and New York for readers in Tokyo. At Haver Analytics, Carol was a member of the Research Department, aiding database managers with research and documentation efforts, as well as posting commentary on select economic reports. In addition, she conducted Ways-of-the-World, a blog on economic issues for an Episcopal-Church-affiliated website, The Geranium Farm. During her career, Carol served as an officer of the Money Marketeers and the Downtown Economists Club. She had a PhD from NYU's Stern School of Business. She lived in Brooklyn, New York, and had a weekend home on Long Island.
More Economy in Brief
 Global| Feb 05 2026
Charts of the Week: Balanced Policy, Resilient Data and AI Narratives
by:Andrew Cates


