 Global| Oct 11 2004
Gross Domestic Product in Singapore Declines 2.3% in Third Quarter
Summary
Singapore showed a decline at an annual rate of 2.3% in its seasonally adjusted Gross Domestic Product in the third quarter according to an advanced estimate. The consensus had expected a slowing of the rate of activity from the [...]
Singapore showed a decline at an annual rate of 2.3% in its seasonally adjusted Gross Domestic Product in the third quarter according to an advanced estimate. The consensus had expected a slowing of the rate of activity from the nearly 12% increases in the first two quarters of this year, but hardly a decline.
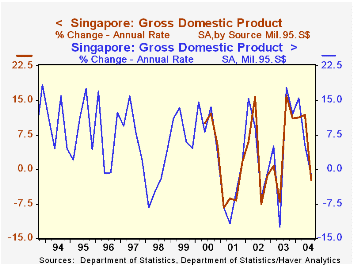
Most measures of Singapore's GDP change are highly erratic. The annual rate of change in the seasonally adjusted data is shown in the attached chart. Since Singapore has been publishing seasonally adjusted data only since the beginning of 2000, we have added the seasonally adjusted series that is computed by Haver Analytics which has a longer history.
Looking at the year over year changes in the nonseasonally adjusted data, we find that GDP was 7.70% above a year earlier in the third quarter, compared with a 12.55% increase in the second quarter and 7.48% in the first quarter.. For the year as a whole, it still seems likely that growth will average close to 8%. Expectations for growth in 2005 have, however, been lowered to 5%. Construction, which showed a 5.12% decline in second quarter from a year earlier, showed a 9.89% year over year decline in the third quarter. The services industries in the third quarter were 7.2% above a year earlier, compared with an 11.5% increase in the second quarter and a 6.29% in the first quarter, while manufacturing in the third quarter rose 12.50% over a year earlier, down from the second quarter's rise of 20.65%, but above the first quarter increase of 10.98%.
Singapore publishes advanced estimates of seasonally and nonseasonally adjusted gross domestic product and nonseasonally adjusted estimates of the manufacturing, construction and service industries. The advance estimates are based on data for the first two months of the quarter. Preliminary estimates, based on data for the three months of the quarter, are released about a month later.
| SINGAPORE GDP (Millions of 1995 Singapore Dollars) |
3Q 04 | 2Q 04 | 1Q 04 | 3Q(%) | 2Q(%) | 1Q(%) | 2003(%) | 2002(%) | 2001(%) |
|---|---|---|---|---|---|---|---|---|---|
| Q/Q | Q/Q | Q/Q | |||||||
| Gross Domestic Product (SA) | 44582 | 44842 | 43599 | -.058 | 2.85 | 2.64 | 1.06 | 2.11 | -1.23 |
| Annual Rate | Annual Rate | Annual Rate | |||||||
| -2.30 | 11.90 | 11.20 | |||||||
| Y/Y | Y/Y | Y/Y | |||||||
| Gross Domestic Product (NSA) | 44729 | 44366 | 43432 | 7.70 | 12.55 | 7.48 | 1.09 | 3.29 | -2.37 |
| Manufacturing | 11575 | 11406 | 10566 | 12.50 | 20.65 | 10.98 | 2.85 | 7.70 | -11.52 |
| Construction | 2005 | 2000 | 2142 | -9.89 | -5.12 | 1.04 | -10.75 | -9.21 | -3.21 |
| Services | 28392 | 28244 | 27745 | 7.20 | 11.59 | 6.29 | 1.03 | 2.62 | 2.08 |
More Economy in Brief

 Global| Feb 05 2026
Charts of the Week: Balanced Policy, Resilient Data and AI Narratives
by:Andrew Cates

