 Global| Dec 05 2005
Growth in Japanese Corporate Profits Slowing
Summary
Corporate profits in Japan have begun to decelerate after the exceedingly good years of 2003 and 2004, but they are still, in the aggregate, showing positive year-over-year changes so far this year. Rising prices, particularly for [...]

Corporate profits in Japan have begun to decelerate after the exceedingly good years of 2003 and 2004, but they are still, in the aggregate, showing positive year-over-year changes so far this year. Rising prices, particularly for energy, and increased wages as the labor market has begun to tighten are the principal factors accounting for the slowdown. The slowdown, however, has varied according to industry and to the size of corporations.
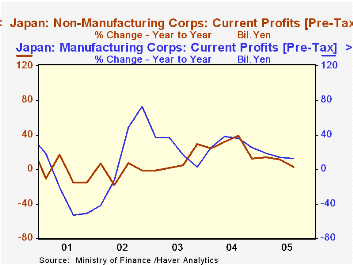
In the third quarter of 2005, profits in the non-manufacturing industry were only 2.39% above the third quarter of 2004, while the corresponding figure for profits in the manufacturing industries was 12.62%. The first chart shows the year-over-year changes in profits for the manufacturing and non manufacturing industries. For the past year, profits in the manufacturing industries have tended to increase faster than those in the non-manufacturing industries. Over the longer term, profits in the manufacturing industries tend to be more volatile than those in the non-manufacturing industries.
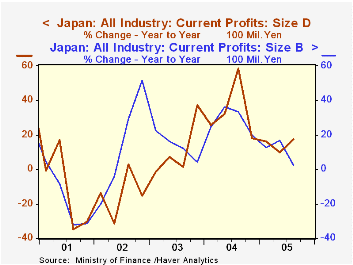
The trend in profits by size of corporation varies widely. Profits in large non-manufacturing corporations declined 3.18% in the third quarter while medium and small sized corporations continued to show year-over-year gains. Profits in large corporations in the manufacturing sector increased 9.25% and those in small corporations were up 42.84%. The weakness in the manufacturing sector was in the profits of medium sized corporation where profits in all three quarters of this year have been lower than those of the corresponding quarters of 2004. (Differences rather than percentage changes are shown for the profits of medium sized corporations because, in the past, this sector has experienced losses and percentage changes cannot be computed from a negative to a positive number). The second chart compares the year-over-year percent changes in profits of all large corporations with those of all small corporations.Note: Profit data for Japanese corporations are found in the JAPAN database in the Financial section under the heading, Corporate Financial Statement, Quarterly Data. Data for all industry, manufacturing and non-manufacturing industries are shown in billions of yen in the section Value of Capital Assets, Liabilities, Equity, Profit and Loss. Data are also available in 100 million yen for corporations in all industry, manufacturing and non manufacturing industries by size of capital under the heading--Financial Statement by Size of Capital.
| Corporate Profits in Japan | Q3 05 Y/Y% | Q2 05 Y/Y% | Q1 05 Y/Y% | 2004 % | 2003 % | 2002 % |
|---|---|---|---|---|---|---|
| All Industries | 6.56 | 12.86 | 15.84 | 27.66 | 12.56 | -0.70 |
| B Large Corp (1 bil Y and over) | 2.68 | 16.49 | 12.81 | 28.22 | 12.82 | 11.01 |
| C Medium (100 mil-1 bil Y) | 3.56 | 4.47 | 24.19 | 20.76 | 19.00 | 10.63 |
| D Small (10 -100 mil Y) | 17.68 | 9.92 | 16.16 | 29.62 | 9.71 | -17.39 |
| Manufacturing | 12.62 | 14.47 | 18.96 | 30.51 | 20.39 | 2.26 |
| B Large Corp (1 bil Y and over) | 9.25 | 13.86 | 16.02 | 28.63 | 24.99 | 6.56 |
| C Medium (100 mil-1 bil Y) | -199 | -119 | -203 | 5953 | 4428 | 1815 |
| D Small (10 -100 mil Y) | 42.84 | 25.31 | 42.33 | 36.01 | 0.49 | -13.24 |
| Non-Manufacturing | 2.39 | 11.89 | 14.02 | 25.77 | 7.92 | -2.37 |
| B Large Corp (1 bil Y and over) | -3.18 | 19.69 | 9.02 | 27.77 | 1.95 | 15.31 |
| C Medium (100 mil-1 bil Y) | 8.50 | 9.36 | 38.88 | 14.21 | 12.84 | 14.21 |
| D Small (10 -100 mil Y) | 9.55 | 5.35 | 10.03 | 27.81 | 12.64 | -18.63 |
More Economy in Brief
 Global| Feb 05 2026
Charts of the Week: Balanced Policy, Resilient Data and AI Narratives
by:Andrew Cates


