 Global| Aug 09 2011
Haver's INTDAILY Database and the Current Financial Crisis
Summary
The Haver Database INTDAILY contains much of the data needed to portray many of the aspects of the current financial crisis. Interest rate spreads can be calculated from the interest rate data. We have calculated the spreads between [...]
 The Haver Database INTDAILY contains much of the data needed to
portray many of the aspects of the current financial crisis.
Interest rate spreads can be calculated from the interest rate data.
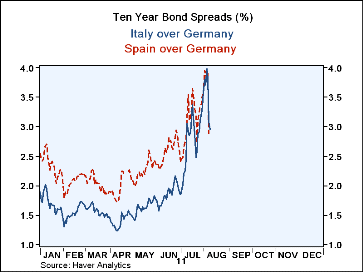
We have calculated the spreads between the 10 year bonds of Italy and
Germany and Spain and Germany. The rise in these spreads. shown in
the first chart, sparked off concern over the debt problems of the two
countries, which was met with the sizeable purchase of Italian and Spanish
bonds by the European Central Bank and the subsequent reduction in the
spreads.
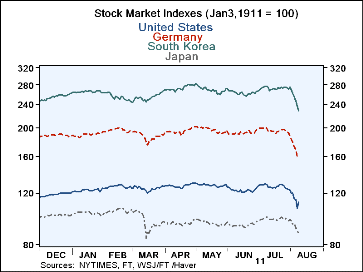
INTDAILY tracks most of the stock markets of the world. The major markets, with the exception of the United States, have continued their declines of the past week or so. As of today, August 9th, it appears that only the United States among the major stock markets has begun to turn up. We rely on news reports for today's stock market activity for the US and Europe as data are not available until the close . To compare movements in the stock markets we have rebased stock market indexes for the U. S., Germany, Japan and South Korea to a common base, January 3, 2011. The new indexes are shown in the second chart, which has a log scale that facilitates percentage comparisons. The markets in the U. S., Germany and South Korea have all declined nearly 20% since July 22, while the market in Japan is down only 10%.
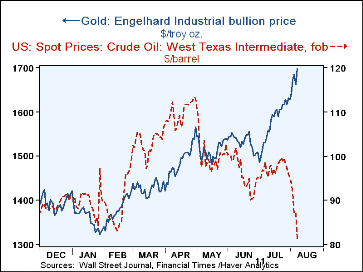
Daily price data reveal the sharp divergence in the prices of gold and oil, as can be seen in the third chart. Gold's status as a haven is responsible for its dramatic price rise, while fears of a "double dip" in the economy suggests lower demand for oil, consequently, lower prices.
These are a few of the kinds of data in INTDAILY. In addition, data are available for exchange rates, price earning ratios and dividend yields for stocks.
| Stock Market Indexes (January 3=100) | Aug 9 | Aug 8 | Aug 6 | Aug 5 | Aug 4 | Aug 3 | Jul 22 | Current from July 22 |
|---|---|---|---|---|---|---|---|---|
| United States | @12.21pm +2.75% | 106.56 | 114.19 | 114.26 | 120.00 | 119.40 | 128.06 | -17.01% |
| Germany | @11.45am -0,10% | 159.11 | 167.51 | 172.31 | 178.38 | 182.57 | 196.8 | -19.16% |
| Japan | 87.56 | 89.06 | 91.04 | 94.56 | 96.37 | 97.55 | 99.19 | -10.19% |
| South Korea | 228.29 | 256.95 | 246.31 | 255.81 | 261.87 | 268.84 | 275.17 | -17.07% |
| Italy over Germany | n.a. | 3.08 | 3.81 | 3.98 | 3.71 | 3.79 | 2.58 | 0.5. |
| Spain over Germany | n.a. | 2.88 | 3.90 | 3.75 | 3.88 | 3.95 | 2.72. | 0.8 |
| Gold $/troy oz | n.a. | 1696 | 1662 | 1683 | 1672 | 1641 | 1590 | 20.72% |
| Oil West Texas $ per bbl | n.a. | 81.27 | 86.89 | 86.75 | 91.87 | 93.79 | 98.11 | -6.25% |
More Economy in Brief
 Global| Feb 05 2026
Charts of the Week: Balanced Policy, Resilient Data and AI Narratives
by:Andrew Cates


