 Global| Aug 18 2008
Home Builders' Survey Shows Tentative Signs of Stabilization
Summary
The National Association of Home Builders reported a stable performance in its Housing Market Index (HMI) for August, albeit at the index’s all-time low of 16, first seen in July. It stood at 22 this time last year and averaged 19 for [...]

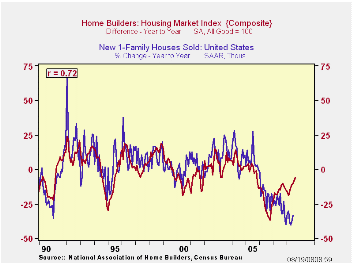
The National Association of Home Builders reported a stable performance in its Housing Market Index (HMI) for August, albeit at the index’s all-time low of 16, first seen in July. It stood at 22 this time last year and averaged 19 for the first six months of 2008. The index is compiled from survey questions asking builders to rate market conditions as “good”, “fair” or “poor” or “very high” to “very low”. Numerical equivalent results over 50 indicate a predominance of “good” readings.
Since 1990, the year-to-year change in this index has had a
correlation of 72% with the year-to-year percentage change in new
single-family home sales (see graph). One
wonders, then, if the relative improvement in the HMI might be a
precursor to an outright improvement in home sales. 
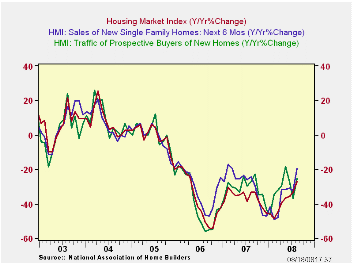
In this regard, the Home Builders Association press release highlights the gains in two of the HMI components. Present sales conditions ticked up from 15 in July to 16 this month and builders’ expectations for six months out moved from 23 to 25. The most tangible measure, the “traffic of prospective buyers” held steady at its all-time low of 12. By region, two parts of the country showed increases, the Northeast and the Midwest. The South was steady and conditions in the West continued to erode. These readings ranged from 11 to 20.
The NAHB has compiled the Housing Market Index since 1985. The results, along with other housing and remodeling indexes from NAHB Economics, are included in Haver’s SURVEYS database.
| Nat'l Association of Home Builders | August | July | Aug '07 | 2007 | 2006 | 2005 |
|---|---|---|---|---|---|---|
| Composite Housing Market Index | 16 | 16 | 22 | 27 | 42 | 67 |
by Louise Curley August 18, 2008

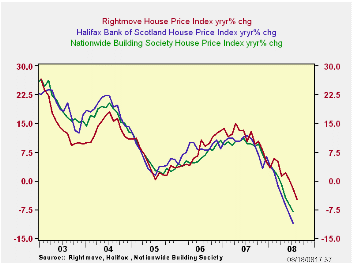
The average asking price for a house coming onto the market in the U.K. declined 4.8% in August from a year ago after a 2.0% year-to-year decline in July. These were the first two declines in the series which was first begun in 2002.
Rightmove's house price index differs from the usual indexes of house prices that measure the price of an average house as in the Nationwide Buildings Societies' survey or the average of house prices as in the Halifax Bank of Scotland's survey. Rightmove compiles the asking prices of properties coming to market through Rightmove Company's 11.500 estate agency branches. The Rightmove index is based on the price a seller initially asks for his property, not what he eventually gets for it.
The year-to-year changes in the three indexes are shown in the accompanying chart. The year-to-year declines in actual prices of houses have occurred before, and have been deeper than, the year-to-year changes in the Rightmove index. The recent year-to-year declines in the Rightmove index suggest that the actual declines in house prices have at last begun to affect sellers' appraisals of their properties.
| UK HOUSE PRICES INDEXES (NSA) | Aug 08 | Jul 08 | Aug 07 | Y/Y % chg | 2007 | 2006 | 2005 |
|---|---|---|---|---|---|---|---|
| Rightmove (Jan 2002=100) | 187.0 | 191.4 | 196.5 | -4.83 | 191.2 | 172.0 | 159.4 |
| Jul 08 | Jun 08 | Jul 07 | Y/Y % chg | 2007 | 2006 | 2005 | |
| Halifax Bank of Scotland (1983=100) | 577.5 | 588.3 | 649.2 | -11.04 | 634.5 | 580.3 | 535.6 |
| Nationwide Building
Societies (Q1 1993=100) |
337.8 | 343.9 | 367.6 | -8.11 | 361.8 | 331.4 | 311.4 |
Carol Stone, CBE
AuthorMore in Author Profile »Carol Stone, CBE came to Haver Analytics in 2003 following more than 35 years as a financial market economist at major Wall Street financial institutions, most especially Merrill Lynch and Nomura Securities. She has broad experience in analysis and forecasting of flow-of-funds accounts, the federal budget and Federal Reserve operations. At Nomura Securites, among other duties, she developed various indicator forecasting tools and edited a daily global publication produced in London and New York for readers in Tokyo. At Haver Analytics, Carol is a member of the Research Department, aiding database managers with research and documentation efforts, as well as posting commentary on select economic reports. In addition, she conducts Ways-of-the-World, a blog on economic issues for an Episcopal-Church-affiliated website, The Geranium Farm. During her career, Carol served as an officer of the Money Marketeers and the Downtown Economists Club. She has a PhD from NYU's Stern School of Business. She lives in Brooklyn, New York, and has a weekend home on Long Island.


