 Global| Aug 13 2020
Housing Affordability Worsened in June from May, But Improved from a Year Ago
Summary
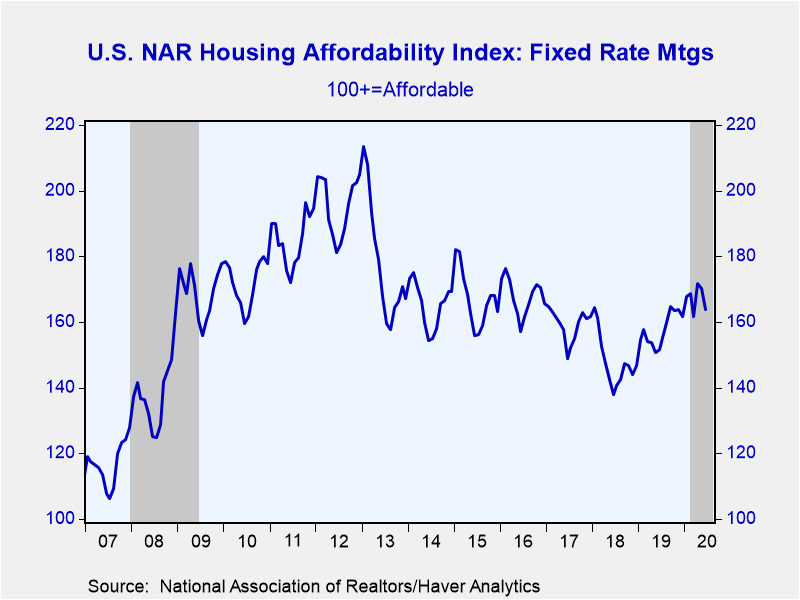
• Falling incomes offset record low mortgage interest rates. The National Association of Realtors reported that its Fixed Rate Mortgage Housing Affordability Index declined 3.8% to 163.7 in June (+7.9% y/y) from a 0.9% drop in May [...]
• Falling incomes offset record low mortgage interest rates.
The National Association of Realtors reported that its Fixed Rate Mortgage Housing Affordability Index declined 3.8% to 163.7 in June (+7.9% y/y) from a 0.9% drop in May (+12.9% y/y). The index had reached a four-year high in April.
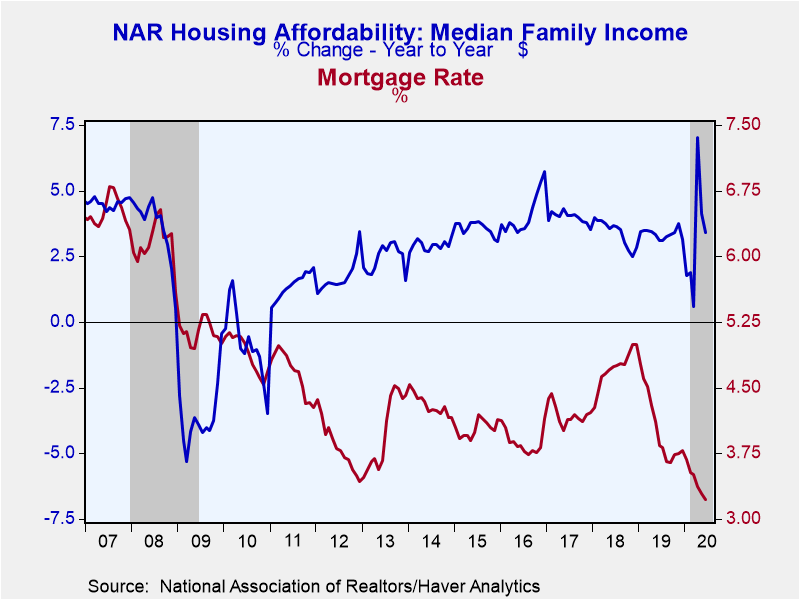
Median family income, which is projected by the National Association of Realtors, dropped 0.6% in June (+3.4% y/y), following a steeper 2.5% monthly decline in May (+4.2% y/y). Family income had jumped 6.6% in April (+7% y/y), reflecting the sharp rise in government transfers. A drop in government support programs ensued in May and June, explaining the monthly declines in income during these two months.
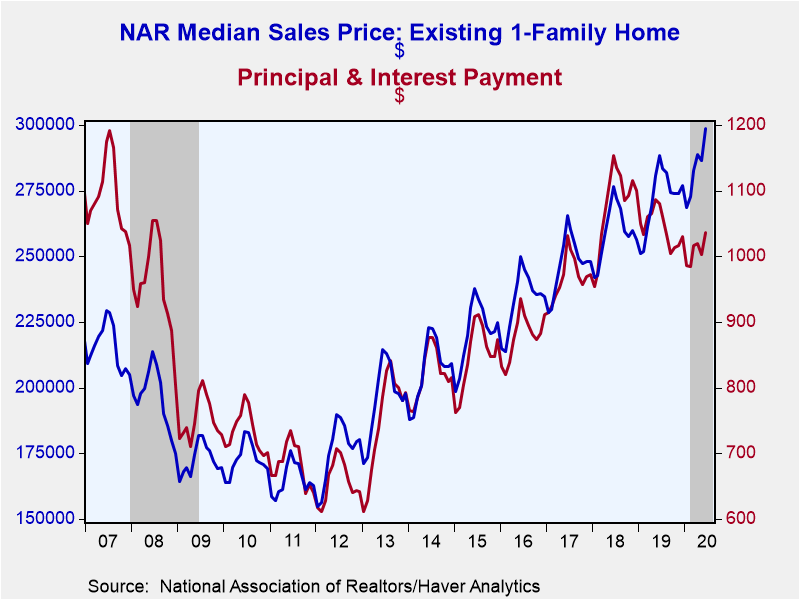
The effective mortgage interest rate declined to a new record low of 3.22% in June, from 3.29% in May and down from an average 4% in 2019, while the median sales price rose 4.2% to $298,600.
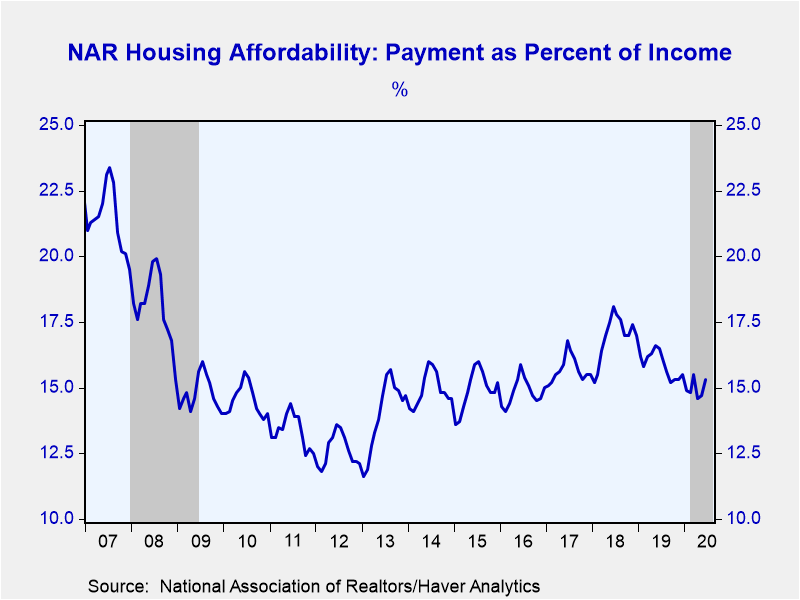
All in all, these changes pushed up the monthly principal and interest payments to $1036 in June from $1,003 in May, while the payment share of income rose to 15.3% from 14.7%.
The Housing Affordability Index equals 100 when median family income qualifies for an 80% mortgage on a median-priced existing single-family home. A rising index indicates an increasing number of buyers can qualify for a mortgage to purchase the median-priced home. Data on Home Affordability can be found in Haver's REALTOR database. Median sales prices are located in USECON. Higher frequency interest rate data can be found in SURVEYW, WEEKLY, and DAILY.
| Housing Affordability | Jun | May | Apr | Y/Y% | 2019 | 2018 | 2017 |
|---|---|---|---|---|---|---|---|
| Fixed Rate Housing Affordability Index (100+ = Affordable) | 163.7 | 170.2 | 171.7 | 7.9 | 157.6 | 147.9 | 159.1 |
| Payment as a Percent of Income | 15.3 | 14.7 | 14.6 | 16.5 | 15.9 | 17.0 | 15.7 |
| Principal and Interest Payment ($) | 1,036 | 1,003 | 1,020 | -4.2 | 1,044 | 1,079 | 967 |
| Monthly Fixed Mortgage Rate (%) | 3.22 | 3.29 | 3.37 | 3.84 | 4.04 | 4.72 | 4.20 |
| Median Family Income ($) | 81,424 | 81,931 | 84,059 | 3.4 | 78,964 | 76,401 | 73,891 |
| Median Sales Price (Existing Single Family Home, $) | 298,600 | 286,600 | 288,700 | 3.5 | 272,333 | 259,458 | 247,508 |
Kathleen Stephansen, CBE
AuthorMore in Author Profile »Kathleen Stephansen is a Senior Economist for Haver Analytics and an Independent Trustee for the EQAT/VIP/1290 Trust Funds, encompassing the US mutual funds sponsored by the Equitable Life Insurance Company. She is a former Chief Economist of Huawei Technologies USA, Senior Economic Advisor to the Boston Consulting Group, Chief Economist of the American International Group (AIG) and AIG Asset Management’s Senior Strategist and Global Head of Sovereign Research. Prior to joining AIG in 2010, Kathleen held various positions as Chief Economist or Head of Global Research at Aladdin Capital Holdings, Credit Suisse and Donaldson, Lufkin and Jenrette Securities Corporation.
Kathleen serves on the boards of the Global Interdependence Center (GIC), as Vice-Chair of the GIC College of Central Bankers, is the Treasurer for Economists for Peace and Security (EPS) and is a former board member of the National Association of Business Economics (NABE). She is a member of Chatham House and the Economic Club of New York. She holds an undergraduate degree in economics from the Universite Catholique de Louvain and graduate degrees in economics from the University of New Hampshire (MA) and the London School of Economics (PhD abd).
More Economy in Brief
 Global| Feb 05 2026
Charts of the Week: Balanced Policy, Resilient Data and AI Narratives
by:Andrew Cates


