 Global| Feb 06 2012
Housing Prices In The UK
Summary
Halifax house price data in the U. K. were released today. Halifax provides data on house prices in index form (1993=00) and in value in pounds both a national and regional base. The national data include prices for new buyers and for [...]
 Halifax house price data in the U. K. were released
today. Halifax provides data on house prices in index form (1993=00)
and in value in pounds both a national and regional base. The
national data include prices for new buyers and for
former owner occupants The average price of a house
increased 1,019 Pounds from December to 160,907 Pounds in January, but was
2,702 Pounds below January, 2011. The index of house prices
increased 3.3% from December to January, but was 8.7% below January, 2011.
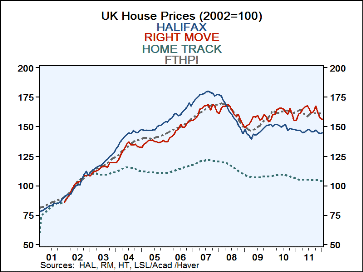
The Halifax price is but one of several measures of house prices publishes in the U.K. a number of different measures of house prices. In addition to the Halifax measure, there are prices published by Home Track, Right Move and FT Housing Prices
Home Track data are based on local housing market information sent by real estate agents from all around England and Wales. Data are mix adjusted. In addition to prices, Home Track lists the sales price as a percent of the asking price, the average time it takes to sell the property and the average number of viewings per sale.
Right Move Price Index (January, 2000 =100) is based on a sample of some 200,000 houses representing 80% of the market. Data are available for type of house: detached, semi detached, terraced and apartments. This house price index differs from others in that it reflects the asking price when the house first comes on the market while other indexes reflect prices later in the buying and selling process.
The FT House Price Index (FTHPI) is derived from the Land Registry house price data. House price data are mix adjusted by property type and smoothed to show underlying trends. FTHPI is the only data based on the actual prices at which every property; were transacted. Data are given in pounds for Wales and the various regions of England. In addition there is and index (January, 2000=100) for England and Wales. These data tend to be lower than the prices in the other indexes.
The four measures of house prices are shown in the attached chart. They are all indexed to 2002=100 to facilitate comparison.
More Economy in Brief
 Global| Feb 05 2026
Charts of the Week: Balanced Policy, Resilient Data and AI Narratives
by:Andrew Cates


