 Global| Oct 04 2007
Housing Starts by State: Weak, Yes, But Gains in August Where You Wouldn't Expect
Summary
It's widely known that the housing market has been in a deep slump. And it's also said that the impact is not uniform across the country, but is concentrated in a number of select states. Some evidence for that arrived this morning in [...]

It's widely known that the housing market has been in a deep slump. And it's also said that the impact is not uniform across the country, but is concentrated in a number of select states. Some evidence for that arrived this morning in the form of housing starts data by state.
Ah, but the Census Bureau doesn't produce starts data for states, you argue. Indeed. But the researchers at Bank of Tokyo-Mitsubishi UFJ compile surrogates from the Census Bureau's building permits data and from the starts data for regions and their seasonal factors. The BOT-Mitsubishi series are available in Haver's REGIONAL database. The underlying building permits are in Haver's collection of state, county and metro area PERMITS databases.
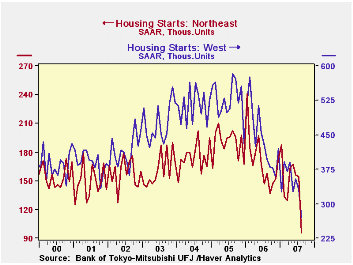
In August, then, total national housing starts fell 36,000 units (SAAR) or 2.6% from July. They are 41.9% below their peak in January 2006. The regions are all quite distinct from the national total and from each other. In the Northeast, the Census data show that starts had moderate erosion until this last month; a 37.8% drop in that one month put them 60.2% below their peak, which was also in January 2006. This is now the biggest decline from peak of any region. In the West, starts fell 18.4% in August; they are now 53.5% below their peak, which occurred back in August 2005. In the other two regions, the South and the Midwest, starts rose in August. In the South, they were up 11.4%, and 4.2% in the Midwest. The South's activity level is 38.1% below its peak in January 2006 and the Midwest's, 44.5% below its peak in February 2005.
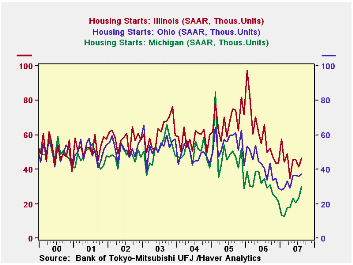
It is actually the Midwest that is perhaps most interesting.Recent mortgage delinquency data show a concentration of difficulties in this area, with Michigan and Ohio both experiencing significantly worse performances than most other states. But in both cases, construction of new houses has started to move higher. According to the Bank of Tokyo-Mitsubishi calculations, starts in Michigan, seen in the second graph, have risen from a mere 12,600 (seasonally adjusted annual rate) six months ago to 30,110 in August. This is still quite low by historical comparison, but the climb has been steady and progressive through the spring and summer. In Ohio, starts are up just moderately, but they have remained higher all year long since an apparent trough in January. The bottom in Illinois is more recent, April, but the pattern since then gives signs of stability.
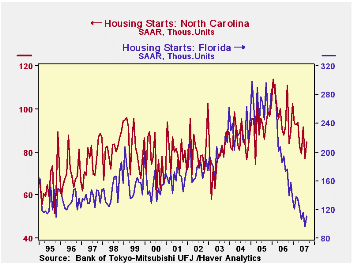
The performances in other states indicate wide divergence. An easy comparison is between the two big Southern states, Florida and North Carolina. Both are well down in the last 18 months or so, but the plunge in Florida housing activity has been far steeper, 62% from a peak in February 2006. North Carolina's starts have held up relatively better, with a 25% decline since January 2006. Both states saw modest increases in August, but their monthly changes are erratic enough to keep us from concluding that there's an outright upturn in the works. The sudden drop in the Northeast occurred in New York, where starts plunged from 62,000 in July to just 29,000 in August; one state in the region saw an increase, New Jersey, but only modestly.
August starts were down in nearly every state in the West. California is perhaps most notable, but others, even those that had been hovering in a narrow range, saw their activity decline in the month. Ironically, one state we've heard a lot about from a mortgage quality standpoint, Nevada, actually saw its housing starts increase, reaching their best level since April. Even so, the pace there, at 23,000 annual rate in August, is still only about half what it was two years before.
| Housing Starts, 000, SAAR | Aug 2007 | July 2007 | June 2007 | Peak | 2006 | 2005 | 2004 |
|---|---|---|---|---|---|---|---|
| Total US | 1,331 | 1,367 | 1,468 | 2,292 (Jan 2006 | 1,801 | 2,068 | 1,956 |
| Northeast | 96 | 154 | 156 | 241 (Jan 2006) | 167 | 190 | 175 |
| Midwest | 248 | 238 | 232 | 446 (Feb 2005) | 28 | 357 | 356 |
| South | 716 | 643 | 726 | 1,156 | 910 | 996 | 908 |
| West | 271 | 332 | 354 | 583 | 444 | 525 | 516 |
Carol Stone, CBE
AuthorMore in Author Profile »Carol Stone, CBE came to Haver Analytics in 2003 following more than 35 years as a financial market economist at major Wall Street financial institutions, most especially Merrill Lynch and Nomura Securities. She had broad experience in analysis and forecasting of flow-of-funds accounts, the federal budget and Federal Reserve operations. At Nomura Securities, among other duties, she developed various indicator forecasting tools and edited a daily global publication produced in London and New York for readers in Tokyo. At Haver Analytics, Carol was a member of the Research Department, aiding database managers with research and documentation efforts, as well as posting commentary on select economic reports. In addition, she conducted Ways-of-the-World, a blog on economic issues for an Episcopal-Church-affiliated website, The Geranium Farm. During her career, Carol served as an officer of the Money Marketeers and the Downtown Economists Club. She had a PhD from NYU's Stern School of Business. She lived in Brooklyn, New York, and had a weekend home on Long Island.
More Economy in Brief
 Global| Feb 05 2026
Charts of the Week: Balanced Policy, Resilient Data and AI Narratives
by:Andrew Cates


