 Global| Aug 07 2012
Indonesia's Q2 GDP Good, But...
Summary
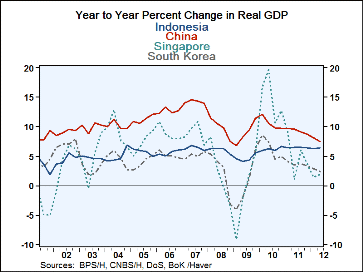
Indonesia is one of the brighter spots among the emerging economies of the far East. The year to year increase in GDP was 6.39% in the second quarter, up from 6.31% in the first quarter and second only to growth in China. The first [...]
 Indonesia is one of the brighter spots among the
emerging economies of the far East. The year to year increase in GDP
was 6.39% in the second quarter, up from 6.31% in the first quarter and
second only to growth in China. The first chart shows the growth of
a few of far eastern countries that have reported second quarter
GDP. Growth accelerated in Indonesia in the second quarter while it
decelerated in China and South Korea. Growth in Singapore,
like that in Indonesia, accelerated in the second quarter, but at a much
lower level.
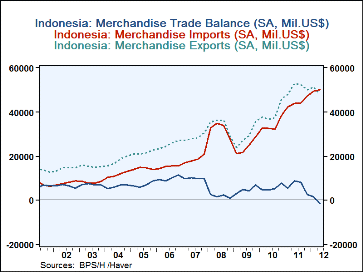
The slight acceleration in growth in the economy of Indonesia occurred in spite of a year to year decline of 28.8% in net exports of goods and services, the result of an 11.1% rise in imports of goods and service and a 1.5% decline in exports of goods and services. The decline in the exports of goods and services was due largely to the decline in the export of goods rather than of services and the rise in imports was also due to the import of good rather than services. The increase in imports could be associated, in part, with the increase in fixed investment. The second chart shows the trade in goods: exports, imports and balance. The second quarter saw Indonesia's first negative balance of trade.
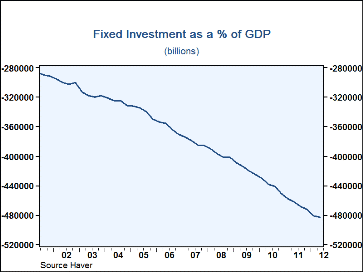
Fixed investment and inventory accumulation helped offset the decline in net exports of goods and services. Fixed investment rose 12.2% on a year to year basis and inventories added 13.trillion Rupiahs to the economy. Fixed investment has been an important factor in the growth of the Indonesian economy, as can be seen in the third chart . It currently accounts for 26% of GDP.
While the year to year growth in the Indonesian economy is encouraging, a word or two of caution is appropriate. The decline in exports in the face of a declining rupiah is a cause for concern. In addition, an increase in inventories is not necessarily a positive development and an increase in the statistical discrepancy has no economic significance.
| Q2 '12 | Q1 '12 | Q2 '11 | M/M %Chg | Y/Y %Chg | 2011 %Chg | 2010 %Chg | 2009 %Chg | |
|---|---|---|---|---|---|---|---|---|
| GDP (Trillions of Rupiahs) | 649.7 | 639.2 | 610.7 | 1.65 | 6.39 | 6.46 | 6.20 | 4.63 |
| Net Exports of Goods and Services | 50.3 | 71.2 | 70.7 | -29.3 | -28.8 | 14.5 | 8.5 | 11.7 |
| Fixed Investment | 166.3 | 157.8 | 148.2 | 5.39 | 12.21 | 8.81 | 8.50 | 3.29 |
| Inventory Change | 24.2 | 16.9 | 10.3 | 7.3 | 13.8 | 10.8 | 13.0 | -4.5 |
| Statistical Discrepancy | -2.1 | -11.0 | 8.7 | 8.9 | 6.6 | -8.0 | 5.4 | 4.1 |
| Trade in Goods (Billion of US$) | ||||||||
| Exports | 48.2 | 51.2 | 52.9 | -3.1 | -4.7 | 45.3 | 41.7 | -21.1 |
| Imports | 49.8 | 49.5 | 44.0 | 0.3 | 4.8 | 41.7 | 39.1 | -32.4 |
| Balance | -1.6 | 1.7 | 8.1 | -3.3 | -10.6 | 3.6 | 2.5 | 11.3 |
More Economy in Brief
 Global| Feb 05 2026
Charts of the Week: Balanced Policy, Resilient Data and AI Narratives
by:Andrew Cates


