 Global| Jun 04 2007
Indonesia's Trade Balance Rises: Malaysia's Declines Reflecting Composition of Exports
Summary
Indonesia and Malaysia reported today data on trade in goods for April. Because of the volatility in the month to month data we have used a three month moving average in the discussion that follows and in the charts. Indonesia reports [...]

Indonesia and Malaysia reported today data on trade in goods for April. Because of the volatility in the month to month data we have used a three month moving average in the discussion that follows and in the charts. Indonesia reports its trade date in U. S. dollars while Malaysia reports its data in Malayasian ringgits. To facilitate comparison between the two countries we have used trade figures for Malaysia expressed in U.S. dollars that Haver has calculated. All these data are found in Indonesia and Malaysia in the EMERGEPR data base
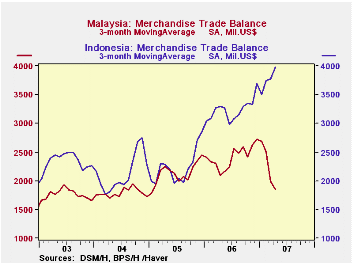
In the first four months of this year, the three month moving average of Indonesia's trade balance has risen steadily while that of Malaysia has steadily declined as can be seen in the first chart. The composition of exports, which is very different in the two countries, accounts, in large part, for the divergent trends. Indonesia's main exports are oil and gas, agricultural products, mineral, rubber and wood products, which are in demand world wide. Malay's exports, on the other hand, are largely manufactured goods. For the last several years, manufactured goods accounted for roughly 80% of total exports. And of the manufactured goods exports, electronics and electrical products accounted for some 60-65%. The demand for electronic and electrical products has fallen off recently, particularly in the United States, Malaysia's largest export market.
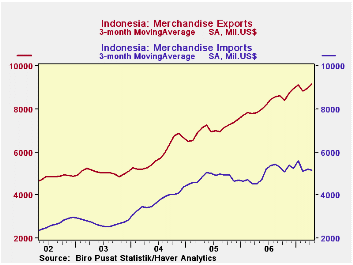
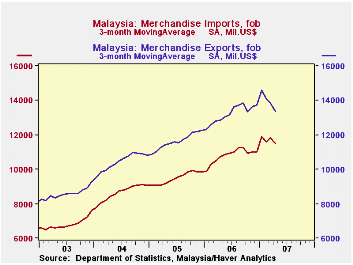
Indonesia' trade balance has increased not only due to a rise in exports, but also a decline in imports as shown in the second chart. Imports into Malaysia have also declined, but the greater decline in exports has resulted in a narrowing of its trade balance as shown in the third chart.
| Trade in Goods: Indonesia & Malaysia (3 mo moving avg. Mil US$) |
Apr 07 | Mar 07 | Feb 07 | Jan 07 |
|---|---|---|---|---|
| Indonesia | ||||
| Exports | 9,156.9 | 8,968.0 | 8,833.5 | 9,109.8 |
| Imports | 5,182.1 | 5,200.6 | 5,093.6 | 5,609.3 |
| Balance | 3,944.8 | 3,767.9 | 3,739.9 | 3,500.5 |
| Malaysia | ||||
| Exports | 13,370 | 13,814 | 14,099 | 14,587 |
| Imports | 11,518 | 11,814 | 11,596 | 11,897 |
| Balance | 1,852.6 | 2,000.4 | 2,502.9 | 2,689.8 |
More Economy in Brief
 Global| Feb 05 2026
Charts of the Week: Balanced Policy, Resilient Data and AI Narratives
by:Andrew Cates


