 Global| Apr 10 2006
Industrial Production in Europe: East and West
Summary
February industrial production data for Sweden, France, the Czech Republic and Slovenia were released today. In each case there was a decline from January in the seasonally adjusted data. Except for France, however, the February [...]

February industrial production data for Sweden, France, the Czech Republic and Slovenia were released today. In each case there was a decline from January in the seasonally adjusted data. Except for France, however, the February figures for each country were above February, 2005, indicating that the positive trends in industrial production in these countries were still in place.
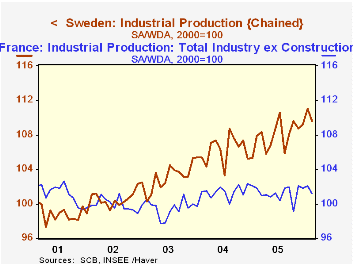
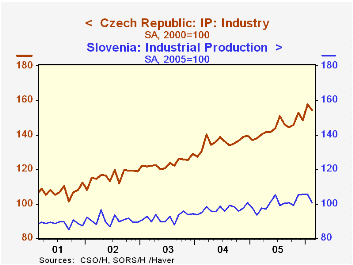
The first chart shows the indexes of industrial production for Sweden and France and the second, for the Czech Republic and Slovenia.(Industrial Production for Slovenia is published on the basis of 2005=100. To facilitate the comparison with the Czech Republic, we have made use of the index function in the list of advanced functions to rebase the Slovene data to 2000=100)
As shown in the first chart industrial production in Sweden has been stronger than in France. In fact, industrial production in France has shown little change over the past five years. In the east, there have also been variations in growth of industrial production as indicated in the second chart which shows industrial production in the Czech Republic rising considerably faster than in Slovenia. Industrial production in the eastern European countries has, however, generally increased faster than production in the western European countries over the past five years. In February, industrial production in the Czech Republic was 54% above the average of 2000, in Slovenia it was 17% above its 2000 average, in Sweden, 10% and in France, a mere 1%.
| Industrial Production (2000=100) | Feb 06 | Jan 06 | Feb 05 | M/M % | Y/Y % | 2005 | 2004 | 2003 |
|---|---|---|---|---|---|---|---|---|
| France | 101.2 | 102.1 | 101.8 | -0.88 | -0.59 | 101.3 | 101.3 | 99.5 |
| Sweden | 109.6 | 111.1 | 107.9 | -1.35 | 1.58 | 107.9 | 106.2 | 102.9 |
| Czech Republic | 154.3 | 157.8 | 138.0 | -2.22 | 11.81 | 144.1 | 135.6 | 123.4 |
| Slovenia | 116.9 | 122.9 | 108.4 | -4.82 | 7.82 | 116.3 | 112.7 | 106.9 |
| Addendum: | ||||||||
| Slovenia (2005=100) | 100.6 | 105.7 | 93.3 | -4.82 | 7.82 | 100.0 | 97.0 | 91.9 |
More Economy in Brief
 Global| Feb 05 2026
Charts of the Week: Balanced Policy, Resilient Data and AI Narratives
by:Andrew Cates


