 Global| Jul 10 2012
Industrial Production in France, Italy, the Netherlands and the U.K.
Summary
The United Kingdom and three Euro Area Countries--France Italy and the Netherlands-- released May data on industrial production today. (The data can be found in the G10 data base as well as in the data bases of the individual [...]
 The United Kingdom and three Euro Area
Countries--France Italy and the Netherlands-- released May data on
industrial production today. (The data can be found in the G10
data base as well as in the data bases of the individual
countries.) The UK showed a surprising rise of 1.1% from
April, but this was due almost entirely to the addition of a working day
to May as the government moved a public holiday to June.
Production also increased in Italy by 0.8% but declined 1.4% in the
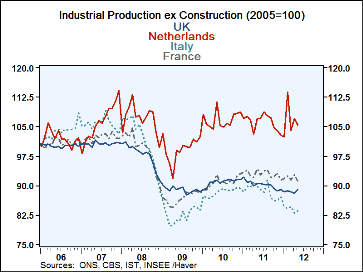
Netherlands and 1.9% in France . The recent production data portray
sluggish economic growth in the UK and the Euro Area as can be seen in the
attached chart.
From a longer term perspective, the Netherlands shows the best performance of the four countries. Although it declined in May, the Netherlands, industrial production has shown the greatest growth since 2005. Industrial production in the Netherlands is now roughly 6% above its volume in 2005, while that in France is 9% below, that in the U.K. 11% below and that in Italy 16% below their respective 2005 volumes.
Industrial Production used to be a reasonably good predictor of real GDP. It still is in some countries, but in others there has been a pronounced decline in the correlation between industrial production and real GDP in recent years, probably as a result of the increasing proportion of services in many economies and distortions caused by the recent severe recession. In the UK the correlation between Industrial Production and Real GDP was .88 over the period from Q1,1968 to date and only .50 over the period Q1, 2000 to date. In France the long term correlation ( Q1 1970 to date) between industrial production and real GDP is .95 and the more recent short term (Q1 2000 to date) is .31. In Italy the long term correlation Q1,1981 to date is .94 and the short term, Q1,2000 to date is .36. These changed correlations suggest the industrial production in these three countries has lost some of its predictive ability. In the case of the Netherlands, data for industrial production are available only from January, so the only correlation is for the period Q1,2000 to date where the correlation is .88, suggesting that industrial production in the Netherlands is the only one of the four that is a reasonably good predictor of real GDP.
| Industrial Production ex Construction (2005=100) | May '12 | Apr '12 | Mar '12 | Feb '12 | Jan '12 |
|---|---|---|---|---|---|
| United Kingdom | 89.1 | 88.1 | 88.4 | 88.7 | 88.5 |
| The Netherlands | 105.5 | 107.0 | 104.0 | 113.8 | 102.4 |
| Italy | 83.7 | 83.0 | 84.7 | 84.1 | 84.8 |
| France | 91.0 | 92.8 | 91.5 | 92.5 | 91.7 |


