 Global| Jan 12 2010
Industrial Production In India Continues To Advance
Summary
Industrial production in India increased 3.0% from 298.8 (FY 1993=100) in October to 307.8 in November and was 11.7% greater than November 2008. This follows October's year over year increase of 10.4%. The production of electricity [...]
 Industrial
production in India increased 3.0% from 298.8 (FY 1993=100) in October
to 307.8 in November and was 11.7% greater than November
2008. This follows October's year over year increase of
10.4%. The production of electricity was down 1.7% for the
month but was 3.3% above the year ago level. Mining
production increased less than a third of a percent in November but was
almost 10 above the year ago level. Production in the
manufacturing sector was strong, increasing 4.2% in the month and 12.7%
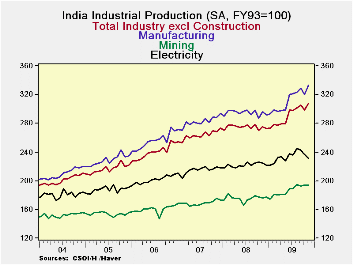
over a year ago. The trends in total production and its major
components over the past six years are shown in the first
chart. The rising trend in production halted in 2008 and
early 2009, but never actually reversed into a decline.
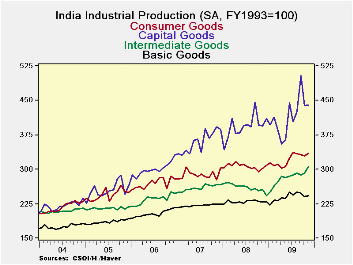
Industrial production for India is also reported for Market Groups, some of which are shown in the second chart. (Recent levels and percentage changes for those market groups not shown in the chart are shown in the table below.) Production of consumer durables was a standout in November with production up 14.0%. A steadily increasing rate of production has brought the production of consumer durable goods 37.4% above that of November 2008 Although capital goods production increased only 0.39% in the month of November it was 11.6% greater than in November 2008. There was a similar pattern in the production of Intermediate Goods, which increased 1.5% in November but was 19.4% above the year ago level.
Rising industrial production in the first two months of the fourth quarter bodes well for growth in the total economy in the fourth quarter. Industrial production has accounted for between 18% and 20% of GDP over the past six years as shown in the third chart.


| Industrial Production (FY1993=100) | Nov 09 | Oct 09 | Nov 08 | M/M % Chg | Y/Y % Chg | 2008 | 2007 | 2006 |
|---|---|---|---|---|---|---|---|---|
| Total | 307.8 | 298.8 | 275.5 | 3.01 | 11.72 | 275.0 | 263.3 | 239.6 |
| Mining | 194.0 | 193.4 | 176.6 | 0.31 | 9.85 | 175.5 | 169.2 | 159.9 |
| Manufacturing | 333.0 | 319.7 | 295.5 | 4.16 | 12.69 | 294.9 | 282.0 | 255.0 |
| Electricity | 232.2 | 236.7 | 224.7 | -1.69 | 3.34 | 222.1 | 214.1 | 201.5 |
| Basic Goods | 243.3 | 241.7 | 229.5 | 0.66 | 6.01 | 229.5 | 221.2 | 203.5 |
| Capital Goods | 440.1 | 438.4 | 394.5 | 0.39 | 11.56 | 392.7 | 359.6 | 300.5 |
| Intermediate Goods | 305.7 | 291.7 | 256.0 | 1.46 | 19.41 | 260.8 | 259.7 | 234.7 |
| Consumer Goods | 335.4 | 329.2 | 302.2 | 1.88 | 10.99 | 306.4 | 288.3 | 269.6 |
| Durable | 516.9 | 453.3 | 376.1 | 14.03 | 37.44 | 389.7 | 377.9 | 378.5 |
| Nondurable | 294.4 | 298.0 | 286.0 | -1.21 | 2.94 | 287.3 | 267.7 | 244.4 |


