 Global| Dec 04 2012
Industrial Strikes Rattle the South African Consumers
Summary
South Africa's Bureau of Economic Research released its quarterly report on consumer confidence for the fourth quarter of 2012 today. The data are expressed in balances of opinion and can be found in the Haver data base EMERGEMA. The [...]
South Africa's Bureau of Economic Research released its quarterly report on consumer confidence for the fourth quarter of 2012 today. The data are expressed in balances of opinion and can be found in the Haver data base EMERGEMA.
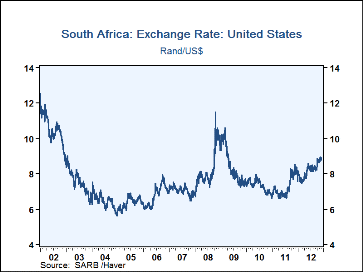
The balance of opinion on consumer confidence fell from -1% in the third quarter to -3% in the fourth. A wave of violent strikes in the third quarter was probably the main reason for the diminished confidence. A strike at the Lonmin mine on August 16, where the police killed 34 people, led to further strikes in the transport and agricultural sectors. These actions are largely responsible for the decline in the balance of opinion regarding the economic position in South Africa during the next 12 months from -8% in the third quarter to -12% in the fourth; and in the rating of the present time for buying of durable goods from -4% in the third quarter to -7% in the fourth. In addition, the South African currency, the Rand, has depreciated some 15% against the dollar since March of this year, making the cost of imported goods more expensive. The recent depreciation of the rand is shown in the first chart.
In spite of the industrial turmoil, South African consumers feel very slightly better about their own financial position, with the balance of opinion rising from 11% in the third quarter to 12% in the fourth. Contributing to the good feeling were the wage increases on the settlement of the strikes. The wage increase for the transport workers was 10% and that for the Lonmin mine workers, 22%. Moreover, employment in the third quarter rose 198,000 after a substantial deceleration in job creation in the first half of the year.
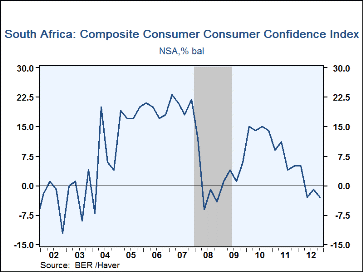
At -3%, the Composite Confidence Index means that more South Africans are pessimistic about the future that are optimistic. Furthermore, it is the lowest percent balance since the fourth quarter of 2008 when the balance of opinion was -4%. as ca be seen in the second chart.
| Weekly Price | Q4'12 | Q3'12 | Q2'12 | Jun 12 | May 12 | Apr 12 | Mar 12 | Feb 12 |
|---|---|---|---|---|---|---|---|---|
| Composite Consumer Confidence Index (%/Balance) | -3 | -1 | -3 | 5 | 5 | 4 | 11 | 9 |
| Economic Position in S.A .during next 12 Months | -12 | -8 | -11 | -6 | -2 | -4 | -5 | -4 |
| Financial Position of HH during next 12 months. | 12 | 11 | 8 | 16 | 17 | 15 | 22 | 20 |
| Rating of Present Time for the Purchase of Durable Goods | -7 | -4 | -5 | 4 | 0 | 2 | 17 | 13 |
| Annual Rate of Growth in GDP (%) | -- | 1.08 | 3.23 | 2.55 | 3.05 | 1.65 | 1.68 | 4.47 |


