 Global| Feb 05 2008
Inflation in the Pacific Rim
Summary
Six of the countries in the emerging markets data base EMERGEPR, which covers the Pacific Rim, have reported January data for the Consumer Price Index. The inflation picture that arises from these data (Defining inflation as the year [...]

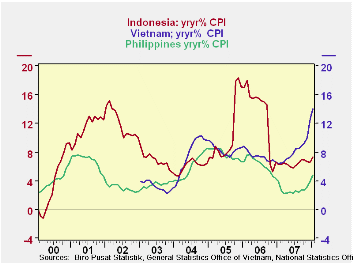
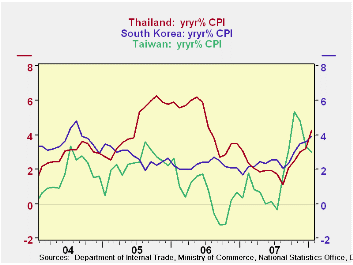
Six of the countries in the emerging markets data base EMERGEPR, which covers the Pacific Rim, have reported January data for the Consumer Price Index. The inflation picture that arises from these data (Defining inflation as the year to year change in the Consumer Price Index) covers a wide span from 2.96% in Taiwan to 14.0% in Vietnam. The first chart shows the headline inflation for Indonesia, Vietnam and the Philippines, the three relatively high inflation countries. The second chart shows the headline inflation for Taiwan, South Korea and Thailand, three relatively low inflation countries. All six countries show a rising trend for inflation over the past six months.
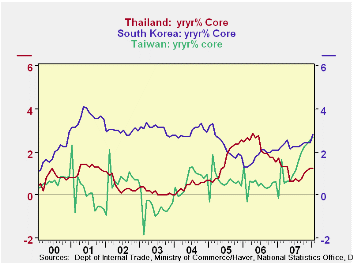
Core inflation rates, excluding food and energy, are available for Thailand since January '91, for South Korea, since January '76 and for Taiwan since January '92 and are shown in the third chart. Core rates of inflation in Korea and Thailand are rising more slowly than the headline series, but in Taiwan, the core rate has spiked in recent months.
Core inflation rates for the Philippines are available only from June, 2004 and for Indonesia, from December 2005. There are no core rates for Vietnam. The rationale for excluding food and energy prices from the Consumer Price index was based on the historical evidence that in industrialized countries these items tended to rise and fall around a fairly trend less norm. It was never clear that the concept should be applied to emerging countries. Recent history, however, suggests that the long term trend in food and energy prices, even in highly developed countries is no longer trend less but definitely rising, casting doubts about the usefulness of the core inflation concept.

| INFLATION IN THE PACIFIC RIM | Jan 08 | Dec 07 | Nov 07 | Oct 07 | Sep 07 | Aug 07 |
|---|---|---|---|---|---|---|
| Year to Year Change in CPI | ||||||
| Indonesia | 7.36 | 6.59 | 6.71 | 6.88 | 6.95 | 6.51 |
| Vietnam | 14.09 | 12.57 | 10.04 | 9.35 | 8.80 | 8.55 |
| Philippines | 4.86 | 3.94 | 3.23 | 2.73 | 2.61 | 2.37 |
| Thailand | 4.26 | 3.21 | 3.03 | 2.51 | 2.09 | 1.13 |
| South Korea | 3.89 | 3.61 | 3.52 | 3.02 | 2.32 | 2.04 |
| Taiwan | 2.96 | 3.33 | 4.80 | 5.33 | 3.11 | 1.61 |
| Year to Year Change in CORE | ||||||
| Thailand | 1.23 | 1.24 | 1.14 | 1.05 | 0.76 | 0.67 |
| South Korea | 2.82 | 2.44 | 2.44 | 2.45 | 2.35 | 2.25 |
| Taiwan | 2.71 | 2.57 | 2.36 | 2.27 | 1.98 | 1.62 |


