 Global| Oct 23 2003
Initial Claims for Jobless Insurance Down
by:Tom Moeller
|in:Economy in Brief
Summary
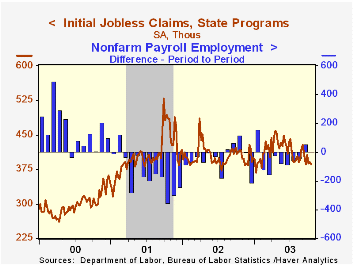
Initial claims for jobless insurance fell 4,000 to 386,000 last week. The modest decline reported initially for last week was revised to a slight increase. Consensus expectations had been for claims of 385,000. The latest figure [...]

Initial claims for jobless insurance fell 4,000 to 386,000 last week. The modest decline reported initially for last week was revised to a slight increase. Consensus expectations had been for claims of 385,000.
The latest figure covers the October survey period for non-farm payrolls. Versus the September survey period claims fell 15,000 (3.7%). during the last ten years there has been a 72% correlation (negative) between the level of initial claims and the m/m change in non-farm payrolls.
The four-week moving average of initial claims fell to 392,250 (-5.5% y/y), the lowest level since early February.
Continuing claims for unemployment insurance fell 84,000 and the increase of 58,000 initially reported for the prior week was lessened to 13,000.
The insured rate of unemployment fell to 2.8% following six months at 2.9%.
| Unemployment Insurance (000s) | 10/18/03 | 10/11/03 | Y/Y | 2002 | 2001 | 2000 |
|---|---|---|---|---|---|---|
| Initial Claims | 386.0 | 390.0 | -7.2% | 404.3 | 406.0 | 299.7 |
| Continuing Claims | -- | 3,542 | -0.9% | 3,575 | 3,022 | 2,114 |
by Tom Moeller October 23, 2003

The Federal Reserve released new figures on the Household Sector Debt Service Ratio. The changes resulted in a slight downward revision to the ratio of debt service to disposable income for 1Q03 to 13.29% from 13.99%. Figures for 2Q03 indicate a ratio of 13.30%. Earlier movement in the series is roughly unchanged.
Recent developments in credit markets necessitated changing some of the sources used to calculate the ratio.There are new sources for the distribution of loan types and for student loans, as well as updated sources for loan maturities and interest rates.
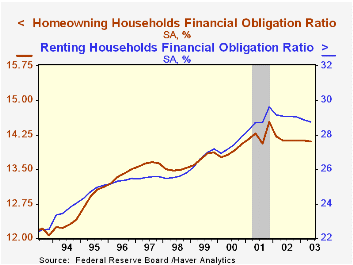
With the addition of recurring obligations such as rent, auto leasing, homeowners insurance and property taxes to the debt service ratio, total Financial Obligations are shown to be 18.09% of disposable income. The financial obligations ratio is broken down to show the Homeowners' and Renters' financial obligations ratio.
| Household Obligation Ratio | 2Q03 | 1Q03 | Y/Y | 2002 | 2001 | 2000 |
|---|---|---|---|---|---|---|
| Total | 18.1% | 18.1% | 18.2% | 18.2% | 18.7% | 18.0% |
| Homeowners | 14.1% | 14.1% | 14.1% | 14.1% | 14.5% | 14.1% |
| Renters | 28.8% | 28.9% | 29.1% | 29.0% | 29.6% | 27.9% |
Tom Moeller
AuthorMore in Author Profile »Prior to joining Haver Analytics in 2000, Mr. Moeller worked as the Economist at Chancellor Capital Management from 1985 to 1999. There, he developed comprehensive economic forecasts and interpreted economic data for equity and fixed income portfolio managers. Also at Chancellor, Mr. Moeller worked as an equity analyst and was responsible for researching and rating companies in the economically sensitive automobile and housing industries for investment in Chancellor’s equity portfolio. Prior to joining Chancellor, Mr. Moeller was an Economist at Citibank from 1979 to 1984. He also analyzed pricing behavior in the metals industry for the Council on Wage and Price Stability in Washington, D.C. In 1999, Mr. Moeller received the award for most accurate forecast from the Forecasters' Club of New York. From 1990 to 1992 he was President of the New York Association for Business Economists. Mr. Moeller earned an M.B.A. in Finance from Fordham University, where he graduated in 1987. He holds a Bachelor of Arts in Economics from George Washington University.
More Economy in Brief
 Global| Feb 05 2026
Charts of the Week: Balanced Policy, Resilient Data and AI Narratives
by:Andrew Cates


