 Global| Mar 08 2007
Initial Claims for Jobless Insurance Hover Around 330K
Summary
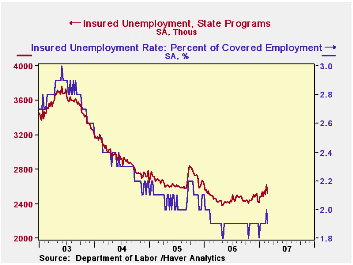
Initial unemployment insurance claims fell 10,000 to 328,000 in the week ended March 3, basically reversing the prior week's 7,000 increase. The figure was marginally lower than Consensus expectations for a decline to 330,000 claims. [...]

Initial unemployment insurance claims fell 10,000 to 328,000 in the week ended March 3, basically reversing the prior week's 7,000 increase. The figure was marginally lower than Consensus expectations for a decline to 330,000 claims.
Despite the drop in the latest week, the four-week moving average of initial claims rose to 339,000, the highest since the Katrina-inflated numbers in the autumn of 2005.
In the week of Feb 24, continuing claims fell 98,000 to 2.526 million after a rise of 118,000 the week before, which likely had been storm-related. This pulled the associated rate of insured unemployment back down to its recent 1.9% average from a one-week move to 2.0%.
| Unemployment Insurance (000s) | 03/03/07 | 02/24/07 | 02/17/07 | 2006 | 2005 | 2004 |
|---|---|---|---|---|---|---|
| Initial Claims | 328 | 338 | 331 | 313 | 332 | 343 |
| Continuing Claims | -- | 2,526 | 2,624 | 2,459 | 2,662 | 2,924 |
by Carol Stone March 8, 2007

Industrial production among a group of European countries reporting today appears to have slowed in January, but is keeping up vigorous trend growth. The largest, Germany, is an exception for the month, with a 1.7% gain in January, but not for the year, as it has seen 8.2% expansion over January 2006. Others have declines for January; these include Sweden, -2.3%, and Hungary, Croatia and Turkey, in the ranges of 0.4% to 0.9%. But all of these also have sizable year-on-year advances.
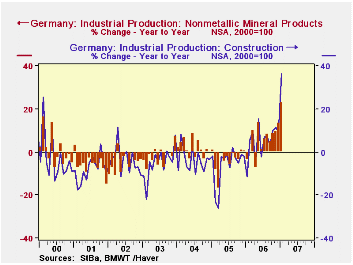
For Germany, the January advance was widespread in areas where production had already been firm: machinery and some transport equipment. There were also increases in textiles, paper and printing, and rubber and plastics. From a longer time perspective, several sectors seem to be benefiting from a resurgence in construction activity since last summer. This was up 36% in January from the year earlier and has pulled with it building materials: concrete, stone, other nonmetallic mineral products, metals and wood products. Electrical equipment has also grown more than the 5.2% average of total industrial production. Thus, we see a broad-based industrial expansion in Germany.
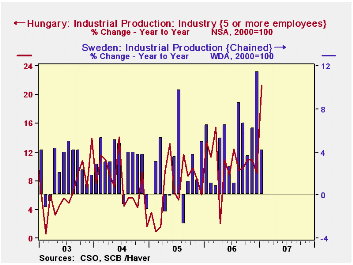
In Sweden, January's 2.3% downturn looks very much like a pause in an uptrend. The year-on-year performance was 4.1% growth, with 5.1% on average for 2006. Machinery, motor vehicles and electrical equipment -- Sweden's known specialties -- have shown good gains over longer time spans despite flat or down moves in January. Longer-run gains are also evident in chemical products, especially pharmaceuticals.
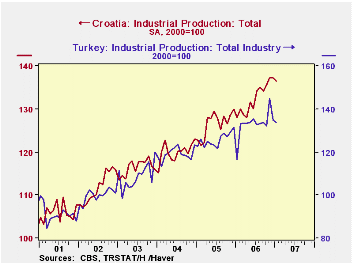
The minor declines in industrial activity in Hungary, Turkey and Croatia also seem to be interruptions of firmer trends. Hungarian output backtracked 0.4% in January, but was up a whopping 21.2% from January 2006. This is a preliminary figure; detailed data through December show double-digit growth in machinery, electrical equipment, transport equipment and "other" manufacturing. In Croatia, industrial production edged down 0.6% in January after a flat reading in December. But the year-on-year gain was 9.1% in January, with numerous and varied sectors participating. In this smaller economy, we should note, other sectors had sharp declines, the more uneven pattern likely owing to fewer firms in each sector that limit the depth of established business patterns.
Turkey's industrial output fell 0.9% in January after a 6.8% decline in December; but November's had risen 9.5% on the month and January's year-over-year change is 14.8%. The growth areas are, as with other countries in the region, concentrated in machinery and the associated metals industries; in Turkey electrical machinery and apparatus contributed to the January growth, while computing equipment decreased somewhat, having expanded by a factor of more than 2 in 2006 -- 121% actually.
| Industrial Production, % changes* |
Jan 2007 | Dec 2006 | Nov 2006 | Year/Year | 2006 | 2005 | 2004 |
|---|---|---|---|---|---|---|---|
| Germany | 1.7 | 0.2 | 1.8 | 8.2 | 5.2 | 2.9 | 4.2 |
| Sweden | -2.3 | 3.1 | 1.1 | 4.1 | 5.1 | 2.3 | 3.2 |
| Hungary | -0.4 | 0.9 | -0.1 | 21.2 | 10.4 | 7.1 | 7.5 |
| Croatia | -0.6 | 0.0 | 1.3 | 9.1 | 4.5 | 5.1 | 3.6 |
| Turkey | -0.9 | -6.8 | 9.5 | 14.8 | 5.8 | 5.4 | 9.8 |
Carol Stone, CBE
AuthorMore in Author Profile »Carol Stone, CBE came to Haver Analytics in 2003 following more than 35 years as a financial market economist at major Wall Street financial institutions, most especially Merrill Lynch and Nomura Securities. She had broad experience in analysis and forecasting of flow-of-funds accounts, the federal budget and Federal Reserve operations. At Nomura Securities, among other duties, she developed various indicator forecasting tools and edited a daily global publication produced in London and New York for readers in Tokyo. At Haver Analytics, Carol was a member of the Research Department, aiding database managers with research and documentation efforts, as well as posting commentary on select economic reports. In addition, she conducted Ways-of-the-World, a blog on economic issues for an Episcopal-Church-affiliated website, The Geranium Farm. During her career, Carol served as an officer of the Money Marketeers and the Downtown Economists Club. She had a PhD from NYU's Stern School of Business. She lived in Brooklyn, New York, and had a weekend home on Long Island.
More Economy in Brief
 Global| Feb 05 2026
Charts of the Week: Balanced Policy, Resilient Data and AI Narratives
by:Andrew Cates


