 Global| Jan 09 2012
Irish Consumers Become More Pessimistic
Summary
Consumer sentiment in Ireland began to improve early this year but took a turn for the worse in November and December as the financial difficulties in the Euro Area intensified. The index of Consumer sentiment (Q4 95=100) finished up [...]
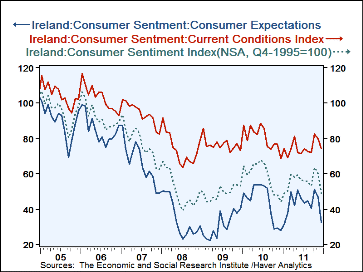
Consumer sentiment in Ireland began to improve early this year but took a turn for the worse in November and December as the financial difficulties in the Euro Area intensified. The index of Consumer sentiment (Q4 95=100) finished up the year in December at 49.2, having advanced from 31.5 In January to 63.9 in October. At the same time the consumers' appraisal of current conditions rose from 74.2 in January to 82.2 in October and ended the year at 74.2, where it had begun. Expectations rose from 31.5 in January to 51.3 In October and fell to 32.4 by December. The indexes of Consumer Sentiment, Current Conditions and Expectations are show in the first chart.
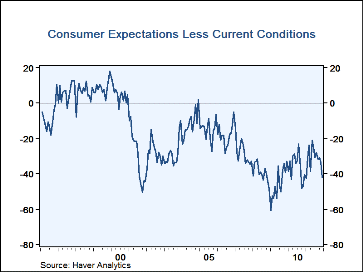
Throughout the period shown in the chart, the index of Expectations has been below that of the index of current conditions, indicating that the consumer has , for some time now, been skeptical that the economy will turn up in the near future. This has not always been the case. The source of the Consumer Sentiment indexes, the Economic and Social Research Institute (ESRI) has been publishing these data since February 1996. The second chart shows the difference between the indexes of current conditions and expectations since their inception. Until about January, 2001, the Irish consumer generally expected that the future would be better than the present. Since then, after the Irish economy collapsed and 10has been slow to recover, the consumer has become increasingly pessimistic.
| Q4 95=100 | Dec 11 |
Nov 11 |
Oct 11 |
Sep 11 |
Aug 11 |
Jul 11 |
Jun 11 |
May 11 |
Apr 11 |
Mar 11 |
Feb 11 |
Jan 11 |
|---|---|---|---|---|---|---|---|---|---|---|---|---|
| Consumer Sentiment | 49.2 | 60.1 | 63.9 | 53.3 | 55.8 | 55.9 | 56.3 | 59.4 | 57.9 | 59.5 | 50.3 | 48.7 |
| Current Conditions | 74.2 | 80.1 | 82.2 | 72.3 | 72.6 | 74.2 | 71.5 | 72.1 | 81.0 | 73.8 | 68.9 | 74.2 |
| Expectations | 32.4 | 46.6 | 51.3 | 40.5 | 44.5 | 43.6 | 46.2 | 50.8 | 42.3 | 49.9 | 37.8 | 31.5 |
More Economy in Brief
 Global| Feb 05 2026
Charts of the Week: Balanced Policy, Resilient Data and AI Narratives
by:Andrew Cates


