 Global| Dec 05 2005
ISM: Activity Expanded Outside the Factory Sector
by:Tom Moeller
|in:Economy in Brief
Summary
The Institute for Supply Management reported that the Business Activity Index for the non-manufacturing sector in November slipped to 58.5 from an unrevised 60.0 the prior month. A reading above 50 indicates expansion. The latest [...]
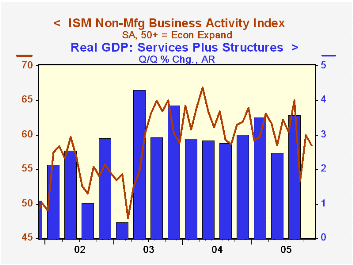
The Institute for Supply Management reported that the Business Activity Index for the non-manufacturing sector in November slipped to 58.5 from an unrevised 60.0 the prior month. A reading above 50 indicates expansion. The latest about matched Consensus expectations for a decline to 59.0.
Since the series' inception in 1997 there has been a 53% correlation between the Business Activity Index and the q/q change in real GDP for services plus construction.
Despite the decline in the Business Activity gauge, the new orders component rose for the second month after a sharp September decline. In addition, the employment index rose 4 points to the highest level since August. Since the series' inception in 1997 there has been a 60% correlation between the level of the ISM non-manufacturing employment index and the m/m change in payroll employment in the service producing plus the construction industries.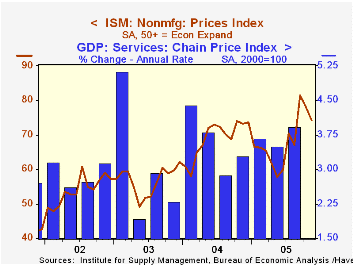
Pricing power fell for the second month after a 14 point September surge. Since inception eight years ago, there has been a 70% correlation between the price index and the y/y change in the GDP Services chain price index.
ISM surveys more than 370 purchasing managers in more than 62 industries including construction, law firms, hospitals, government and retailers. The non-manufacturing survey dates only to July 1997, therefore its seasonal adjustment should be viewed tentatively.Business Activity Index for the non-manufacturing sector reflects a question separate from the subgroups mentioned above. In contrast, the NAPM manufacturing sector composite index is a weighted average five components.
| ISM Nonmanufacturing Survey | Nov | Oct | Nov '04 | 2004 | 2003 | 2002 |
|---|---|---|---|---|---|---|
| Business Activity Index | 58.5 | 60.0 | 61.9 | 62.4 | 58.2 | 55.1 |
| Prices Index | 74.2 | 78.0 | 73.2 | 69.0 | 56.8 | 54.0 |
by Louise Curley December 5, 2005
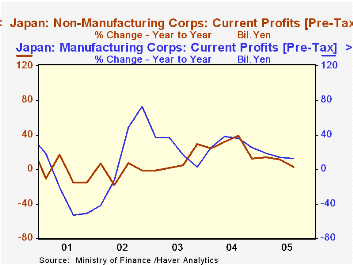
Corporate profits in Japan have begun to decelerate after the exceedingly good years of 2003 and 2004, but they are still, in the aggregate, showing positive year-over-year changes so far this year. Rising prices, particularly for energy, and increased wages as the labor market has begun to tighten are the principal factors accounting for the slowdown. The slowdown, however, has varied according to industry and to the size of corporations.
In the third quarter of 2005, profits in the non-manufacturing industry were only 2.39% above the third quarter of 2004, while the corresponding figure for profits in the manufacturing industries was 12.62%. The first chart shows the year-over-year changes in profits for the manufacturing and non manufacturing industries. For the past year, profits in the manufacturing industries have tended to increase faster than those in the non-manufacturing industries. Over the longer term, profits in the manufacturing industries tend to be more volatile than those in the non-manufacturing industries.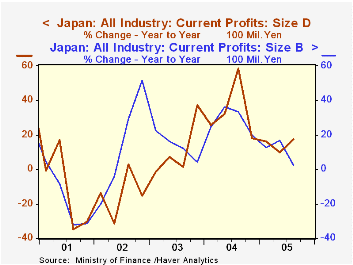
The trend in profits by size of corporation varies widely. Profits in large non-manufacturing corporations declined 3.18% in the third quarter while medium and small sized corporations continued to show year-over-year gains. Profits in large corporations in the manufacturing sector increased 9.25% and those in small corporations were up 42.84%. The weakness in the manufacturing sector was in the profits of medium sized corporation where profits in all three quarters of this year have been lower than those of the corresponding quarters of 2004. (Differences rather than percentage changes are shown for the profits of medium sized corporations because, in the past, this sector has experienced losses and percentage changes cannot be computed from a negative to a positive number). The second chart compares the year-over-year percent changes in profits of all large corporations with those of all small corporations.Note: Profit data for Japanese corporations are found in the JAPAN database in the Financial section under the heading, Corporate Financial Statement, Quarterly Data. Data for all industry, manufacturing and non-manufacturing industries are shown in billions of yen in the section Value of Capital Assets, Liabilities, Equity, Profit and Loss. Data are also available in 100 million yen for corporations in all industry, manufacturing and non manufacturing industries by size of capital under the heading--Financial Statement by Size of Capital.
| Corporate Profits in Japan | Q3 05 Y/Y% | Q2 05 Y/Y% | Q1 05 Y/Y% | 2004 % | 2003 % | 2002 % |
|---|---|---|---|---|---|---|
| All Industries | 6.56 | 12.86 | 15.84 | 27.66 | 12.56 | -0.70 |
| B Large Corp (1 bil Y and over) | 2.68 | 16.49 | 12.81 | 28.22 | 12.82 | 11.01 |
| C Medium (100 mil-1 bil Y) | 3.56 | 4.47 | 24.19 | 20.76 | 19.00 | 10.63 |
| D Small (10 -100 mil Y) | 17.68 | 9.92 | 16.16 | 29.62 | 9.71 | -17.39 |
| Manufacturing | 12.62 | 14.47 | 18.96 | 30.51 | 20.39 | 2.26 |
| B Large Corp (1 bil Y and over) | 9.25 | 13.86 | 16.02 | 28.63 | 24.99 | 6.56 |
| C Medium (100 mil-1 bil Y) | -199 | -119 | -203 | 5953 | 4428 | 1815 |
| D Small (10 -100 mil Y) | 42.84 | 25.31 | 42.33 | 36.01 | 0.49 | -13.24 |
| Non-Manufacturing | 2.39 | 11.89 | 14.02 | 25.77 | 7.92 | -2.37 |
| B Large Corp (1 bil Y and over) | -3.18 | 19.69 | 9.02 | 27.77 | 1.95 | 15.31 |
| C Medium (100 mil-1 bil Y) | 8.50 | 9.36 | 38.88 | 14.21 | 12.84 | 14.21 |
| D Small (10 -100 mil Y) | 9.55 | 5.35 | 10.03 | 27.81 | 12.64 | -18.63 |

Tom Moeller
AuthorMore in Author Profile »Prior to joining Haver Analytics in 2000, Mr. Moeller worked as the Economist at Chancellor Capital Management from 1985 to 1999. There, he developed comprehensive economic forecasts and interpreted economic data for equity and fixed income portfolio managers. Also at Chancellor, Mr. Moeller worked as an equity analyst and was responsible for researching and rating companies in the economically sensitive automobile and housing industries for investment in Chancellor’s equity portfolio. Prior to joining Chancellor, Mr. Moeller was an Economist at Citibank from 1979 to 1984. He also analyzed pricing behavior in the metals industry for the Council on Wage and Price Stability in Washington, D.C. In 1999, Mr. Moeller received the award for most accurate forecast from the Forecasters' Club of New York. From 1990 to 1992 he was President of the New York Association for Business Economists. Mr. Moeller earned an M.B.A. in Finance from Fordham University, where he graduated in 1987. He holds a Bachelor of Arts in Economics from George Washington University.
More Economy in Brief

 Global| Feb 05 2026
Charts of the Week: Balanced Policy, Resilient Data and AI Narratives
by:Andrew Cates

