 Global| Jul 06 2005
ISM Non-Manufacturing Index Recovered
by:Tom Moeller
|in:Economy in Brief
Summary
The Business Activity Index for the non-manufacturing sector recovered in June all of the prior month's decline and rose to 62.2, reported the Institute for Supply Management. Consensus expectations had been for stability at 58.2. [...]
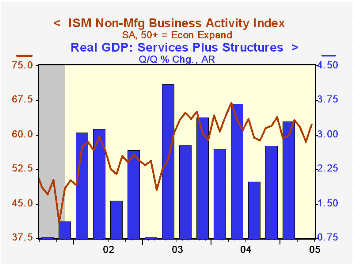
The Business Activity Index for the non-manufacturing sector recovered in June all of the prior month's decline and rose to 62.2, reported the Institute for Supply Management. Consensus expectations had been for stability at 58.2.
Since the series' inception in 1997 there has been a 50% correlation between the Business Activity Index and the q/q change in real GDP for services plus construction.
A higher employment index led the improvement last month. The rise to 57.4 was to the highest level since February. Since the series' inception in 1997 there has been a 60% correlation between the level of the ISM non-manufacturing employment index and the m/m change in payroll employment in the service producing plus the construction industries.
The index of new orders dipped slightly to 59.5 but pricing power recovered a bit.
ISM surveys more than 370 purchasing managers in more than 62 industries including construction, law firms, hospitals, government and retailers. The non-manufacturing survey dates only to July 1997, therefore its seasonal adjustment should be viewed tentatively.Business Activity Index for the non-manufacturing sector reflects a question separate from the subgroups mentioned above. In contrast, the NAPM manufacturing sector composite index is a weighted average five components.
| ISM Nonmanufacturing Survey | June | May | June '04 | 2004 | 2003 | 2002 |
|---|---|---|---|---|---|---|
| Business Activity Index | 62.2 | 58.5 | 61.1 | 62.4 | 58.2 | 55.1 |
| Prices Index | 59.8 | 57.9 | 72.9 | 69.0 | 56.8 | 54.0 |
by Tom Moeller July 6, 2005
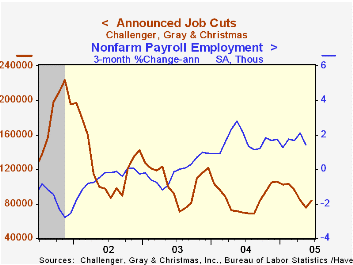
Job cut announcements jumped by more than one third in June and added to a sharp gain in May raising the level to the highest since January 2004. The three month average of job cut announcements also rose but just moderately.
During the last ten years there has been an 84% (inverse) correlation between the three month moving average of announced job cuts and the three month change payroll employment.
Job cut announcements in the automotive industry increased roughly ten-fold m/m. Outside of autos job cut announcement fell m/m (+6.6% y/y). In June job cuts did rise sharply in the retail and pharmaceutical industries.
Job cut announcements differ from layoffs. Many are achieved through attrition, early retirement or just never occur.
Challenger also reported that announced hiring plans improved sharply to the highest level since February.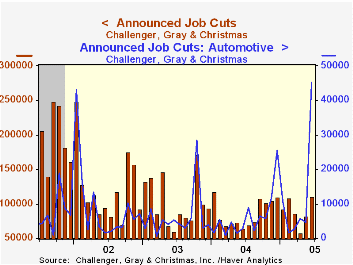
| Challenger, Gray & Christmas | June | May | Y/Y | 2004 | 2003 | 2002 |
|---|---|---|---|---|---|---|
| Announced Job Cuts | 110,996 | 82,283 | 72.5% | 1,039,175 | 1,236,426 | 1,431,052 |
by Tom Moeller July 6, 2005
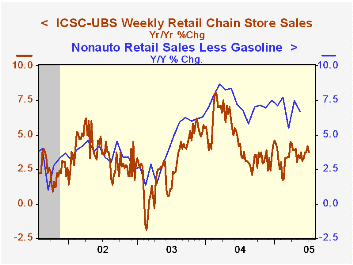
Chain store sales rose 0.5% during the opening week of July following a like-sized drop the prior week, according to the International Council of Shopping Centers (ICSC)-UBS survey. Sales began the month 0.2% above the June average which fell 0.4% versus May.
During the last ten years there has been a 56% correlation between the y/y change in chain store sales and the change in non-auto retail sales less gasoline, as published by the US Census Department. Chain store sales correspond directly with roughly 14% of non-auto retail sales less gasoline.
The leading indicator of chain store sales from ICSC ticked 0.1% higher w/w (+2.2% y/y) following a 0.2% decline the week prior.
The ICSC-UBS retail chain-store sales index is constructed using the same-store sales (stores open for one year) reported by 78 stores of seven retailers: Dayton Hudson, Federated, Kmart, May, J.C. Penney, Sears and Wal-Mart.
| ICSC-UBS (SA, 1977=100) | 07/02/05 | 06/25/05 | Y/Y | 2004 | 2003 | 2002 |
|---|---|---|---|---|---|---|
| Total Weekly Chain Store Sales | 455.2 | 453.0 | 3.8% | 4.6% | 2.9% | 3.6% |
by Tom Moeller July 6, 2005
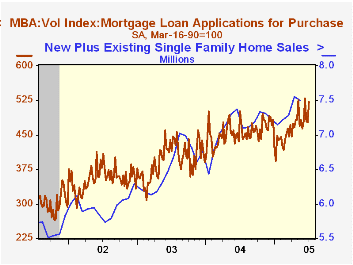
Total mortgage applications surged 9.6% in the opening week of July, according to the Mortgage Bankers Association, and began the month 6.4% above the June average which rose 9.9% versus May.
Purchase applications jumped 9.1% w/w and began the month 6.0% above June which rose 1.3% from May. During the last ten years there has been a 50% correlation between the y/y change in purchase applications and the change in new plus existing single family home sales.
Applications to refinance recovered 10.2% w/w following two weeks of decline and opened the month 6.9% ahead of June.
The effective interest rate on a conventional 30-year mortgage rose to 5.81% following several weeks of decline from the peak of 6.34% in late March. The effective rate on a 15-year mortgage also rose to 5.47% after falling from the peak of 5.96%.
The Mortgage Bankers Association surveys between 20 to 35 of the top lenders in the U.S. housing industry to derive its refinance, purchase and market indexes. The weekly survey accounts for more than 40% of all applications processed each week by mortgage lenders. Visit the Mortgage Bankers Association site here.
| MBA Mortgage Applications (3/16/90=100) | 07/01/05 | 06/24/05 | Y/Y | 2004 | 2003 | 2002 |
|---|---|---|---|---|---|---|
| Total Market Index | 853.4 | 778.4 | 24.2% | 735.1 | 1,067.9 | 799.7 |
| Purchase | 520.8 | 477.4 | 4.0% | 454.5 | 395.1 | 354.7 |
| Refinancing | 2,788.2 | 2,529.2 | 57.6% | 2,366.8 | 4,981.8 | 3,388.0 |
by Carol Stone July 6, 2005
Net rates of return for UK corporations have run strong in the last several quarters. The first quarter's outcome, 13.3%, was the third highest in the 16-year history of these quarterly data. These figures on corporate profitability were reported yesterday, July 5, by the UK Office of National Statistics and have just recently been added to Haver's UK database. The information, called "Profitability of UK Companies", is listed in both the Financial Data and National Accounts menus.
The rates of return are defined as the ratio of the net operating surplus to net capital employed. [The values in "gross" terms, i.e., before the deduction of capital consumption, are also published, but the "net" data get far more attention.] The factors in the ratio, net operating surplus and net capital employed, are published annually; rates of return are available quarterly for all private non-financial corporations and three categories: "Continental Shelf" companies, manufacturing firms and service sector companies. "Continental Shelf" refers to the UK petroleum industry.
In the first quarter, the 13.3% overall return represented a pick-up from the fourth quarter's 13.1% and was equal to the 2004 average of 13.3%. As might be expected, the Continental Shelf firms saw a boost in their return, to 29.6%, up from the prior quarter; the last five years have averaged 30.8%, the highest ever, with a range among individual quarters of 25.6%, right after 9/11, to 38.1% at the end of 2000.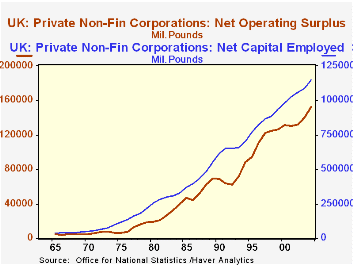
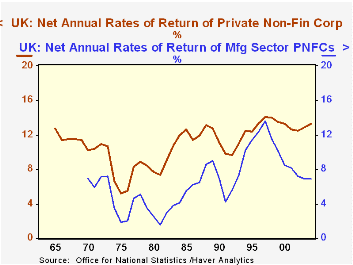
Non-financial service industries experienced their strongest returns in the late 1990s. We'd speculate that computer software developers, internet companies and other tech firms led this high-profit time in the UK, when returns on capital peaked at 19.5% in the second quarter of 1998. The recent period, while lower, isn't "bad", with profitability still running at about 16.5% on average and this latest quarter at 17.5%.
Manufacturing returns have lagged. This has been so for a long time, throughout the history of these data back to 1970. The worst performance was during the energy "crisis"/stagflation recessions of the late 1970s and early 1980s, when, for instance, the net return dipped to just 1.5% in 1981. More currently, manufacturing firms saw good results from 1994 to 1999, but since then have fallen back to single-digits. The 6.0% in Q1 is among the lowest since the 1991 recession. The ONS suggests that the lower returns in manufacturing reflect their higher capital intensity, compared with service firms. This is certainly true, but perhaps their greater cyclicality and variability also restrain their overall performance.
| UK: % except as noted |
Q1 2005 | Q4 2004 | Q3 2003 | 2004 | 2003 | 2002 |
|---|---|---|---|---|---|---|
| Net Rate of Return: All PNFCs* | 13.3 | 13.1 | 13.4 | 13.3 | 12.9 | 12.5 |
| Net Operating Surplus (£ Billions) | 152.2 | 140.2 | 132.2 | |||
| Net Capital Employed (£ Billions) | 1146.4 | 1089.4 | 1056.5 | |||
| Continental Shelf Companies** | 29.6 | 27.6 | 30.5 | 29.1 | 29.2 | 30.4 |
| Manufacturing | 6.0 | 7.7 | 5.8 | 6.9 | 6.9 | 7.2 |
| Service Sector | 17.5 | 15.9 | 16.4 | 16.5 | 16.5 | 16.1 |

Tom Moeller
AuthorMore in Author Profile »Prior to joining Haver Analytics in 2000, Mr. Moeller worked as the Economist at Chancellor Capital Management from 1985 to 1999. There, he developed comprehensive economic forecasts and interpreted economic data for equity and fixed income portfolio managers. Also at Chancellor, Mr. Moeller worked as an equity analyst and was responsible for researching and rating companies in the economically sensitive automobile and housing industries for investment in Chancellor’s equity portfolio. Prior to joining Chancellor, Mr. Moeller was an Economist at Citibank from 1979 to 1984. He also analyzed pricing behavior in the metals industry for the Council on Wage and Price Stability in Washington, D.C. In 1999, Mr. Moeller received the award for most accurate forecast from the Forecasters' Club of New York. From 1990 to 1992 he was President of the New York Association for Business Economists. Mr. Moeller earned an M.B.A. in Finance from Fordham University, where he graduated in 1987. He holds a Bachelor of Arts in Economics from George Washington University.
More Economy in Brief

 Global| Feb 05 2026
Charts of the Week: Balanced Policy, Resilient Data and AI Narratives
by:Andrew Cates

