 Global| Oct 15 2007
Italy's Inflation: Overall Under Control With Some Underlying Erosion
Summary
Italys inflation has fallen for the overall measure. But the chart also shows that the CORE inflation has been on a gradually elevating trend. Both the core and headline rate accelerated slightly in terms of their Yr/Yr rates in [...]
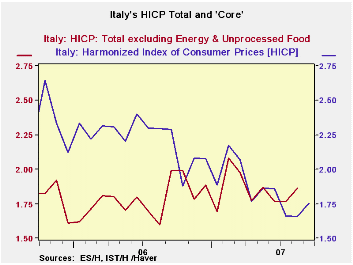
Italy’s inflation has fallen for the overall measure. But the chart also shows that the CORE inflation has been on a gradually elevating trend. Both the core and headline rate accelerated slightly in terms of their Yr/Yr rates in September. Still, the core and the overall rates are nicely below the ECB’s overall 2% inflation ceiling.
In September, Italy’s inflation report was turbulent. It was bifurcated, with six categories showing inflation on the month (m/m %) of 0.3% or greater. But there were also five main categories with the monthly price level actually falling by 0.2% or more. Food, alcohol and education prices were up the most in the month. The weakest prices were at restaurants and hotels, for recreation and culture and for communications. With this sort of turbulence in the market, it is a difficult time to get a read on true inflation trends in Italy. Diffusion readings show that over 3 months and 6 months inflation is accelerating in more categories that it is decelerating. Year-over-year, Italy’s trends are neutral.
| Italy HICP and CPI details | |||||||
|---|---|---|---|---|---|---|---|
| Mo/Mo % | Saar % | Yr/Yr | |||||
| Sep-07 | Aug-07 | Jul-07 | 3-Mo | 6-Mo | 12-Mo | Yr Ago | |
| HICP Total | 0.3% | 0.2% | -0.1% | 1.5% | 1.7% | 1.8% | 2.3% |
| Core | #N/A | 0.2% | 0.0% | #N/A | #N/A | #N/A | 2.0% |
| CPI | |||||||
| All | 0.2% | 0.1% | 0.2% | 1.8% | 2.3% | 1.7% | 2.1% |
| CPI excl Tobacco | 0.2% | 0.1% | 0.3% | 2.1% | 2.3% | 1.6% | 2.1% |
| Food | 0.7% | 0.4% | 0.4% | 6.1% | 4.3% | 2.9% | 2.4% |
| Alcohol | 0.6% | 0.6% | -0.7% | 2.2% | 2.5% | 2.4% | 5.1% |
| Clothing & Shoes | 0.3% | 0.2% | 0.2% | 2.4% | 1.7% | 1.5% | 1.3% |
| Rent & Utilities | 0.3% | 0.2% | 0.0% | 1.9% | 1.1% | 1.4% | 5.7% |
| Housing & Furniture | 0.2% | 0.2% | 0.2% | 2.2% | 3.5% | 2.8% | 1.5% |
| Health Care | -0.2% | 0.2% | 0.1% | 0.3% | -0.8% | -0.2% | 0.0% |
| Transport | -0.2% | -0.7% | 0.6% | -1.4% | 2.4% | 2.0% | 2.0% |
| Communication | -0.3% | 0.0% | 0.0% | -1.1% | -1.4% | -8.8% | -3.4% |
| Recreation & Culture | -0.4% | 0.3% | 0.1% | 0.0% | -0.5% | 0.2% | 1.1% |
| Education | 0.9% | 0.1% | 0.2% | 5.4% | 4.0% | 3.1% | 2.1% |
| Restaurant & Hotel | -0.5% | 0.3% | 0.3% | 0.5% | 2.4% | 2.4% | 2.4% |
| Other | 0.3% | 0.3% | 0.2% | 3.2% | 3.3% | 2.5% | 2.7% |
| Diffusion | 58.3% | 66.7% | 50.0% | ||||
| Type: | Diffusion: Compared to | 6-mo | 12-mo | Yr-Ago | -- | ||

Robert Brusca
AuthorMore in Author Profile »Robert A. Brusca is Chief Economist of Fact and Opinion Economics, a consulting firm he founded in Manhattan. He has been an economist on Wall Street for over 25 years. He has visited central banking and large institutional clients in over 30 countries in his career as an economist. Mr. Brusca was a Divisional Research Chief at the Federal Reserve Bank of NY (Chief of the International Financial markets Division), a Fed Watcher at Irving Trust and Chief Economist at Nikko Securities International. He is widely quoted and appears in various media. Mr. Brusca holds an MA and Ph.D. in economics from Michigan State University and a BA in Economics from the University of Michigan. His research pursues his strong interests in non aligned policy economics as well as international economics. FAO Economics’ research targets investors to assist them in making better investment decisions in stocks, bonds and in a variety of international assets. The company does not manage money and has no conflicts in giving economic advice.
More Economy in Brief

 Global| Feb 05 2026
Charts of the Week: Balanced Policy, Resilient Data and AI Narratives
by:Andrew Cates

