 Global| Nov 14 2011
Japan: First Estimate 3Q GDP Growth
Summary
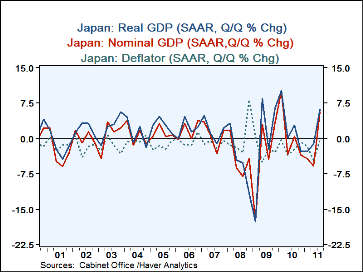
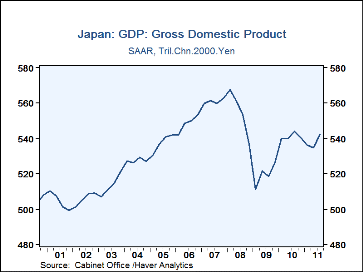
Japan's real GDP rose at a seasonally adjusted annual rate (SAAR) of 6% in the third quarter, reflecting the recovery from the Tohoku earthquake and tsunami on March 12, of this year. The level of GDP is now just below its pre [...]
 Japan's real GDP rose at a seasonally adjusted annual rate (SAAR)
of 6% in the third quarter, reflecting the recovery from the Tohoku
earthquake and tsunami on March 12, of this year. The level of GDP
is now just below its pre disaster peak of the third quarter of 2010, as
can be seen in the first chart. The nominal rise in GDP was
5.6% (SAAR), indicating that deflation continues. The quarter to
quarter (SAAR) of inflation was -0.3% , compared with -4.6% in the second
quarter.
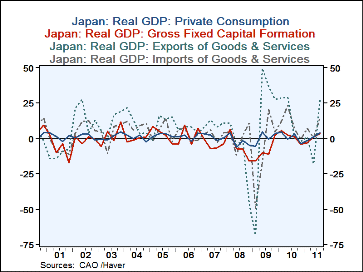
Domestic demand was fed by a 3.9 (SAAR) rise private consumption and a 3.4 (SAAR) rise in fixed capital formation. Exports increased 27.4 (SAAR) after having declined 19.4 (SAAR) in the second quarter. Offsetting the rise in exports was a 14.5 (SAAR) rise in imports. The increases in the various components of GDP are shown in the second chart.
The first estimate of a quarterly change in GDP is generally revised as more data become available. Such revisions to Japan's third quarter estimate are likely to be on the negative side. The impact of the financial crisis in the Euro Area has probably not yet been fully accounted for in the data. However, even if the current estimate of growth in the third quarter holds up, the outlook for the Japanese economy beyond the third quarter is now clouded by the continuing floods in Thailand that began in late July. Japan has outsourced a significant portion of its automobile production to Thailand andthe disruption to production
| JAPAN | Q3 11 | Q2 11 | Q1 11 | Q4 10 | Q3 10 | Q2 10 | Q1 10 |
|---|---|---|---|---|---|---|---|
| GDP (SAAR %Change) | |||||||
| Nominal | 5.6 | -5.8 | 4.3 | -3.5 | 0.5 | -3.6 | 9.9 |
| Real | 6.0 | -1.3 | -2.9 | -2.7 | 2.9 | 0.1 | 10.2 |
| Deflator | -0.3 | -4.6 | -1.7 | -0.8 | -2.4 | -3.3 | -0.3 |
| Private Consumption | 3.9 | 0.7 | -1.8 | -3.4 | 2.7 | 0.8 | 4.7 |
| Fixed Capital Formation | 3.4 | 1.0 | -3.2 | -3.9 | 1.1 | 2.5 | 5.4 |
| Exports | 27.4 | -18.4 | 1.0 | -1.9 | 0.6 | 29.2 | 28.9 |
| Imports | 14.5 | 0.4 | 6.8 | -0.8 | 6.3 | 23.0 | 12.0 |
More Economy in Brief
 Global| Feb 05 2026
Charts of the Week: Balanced Policy, Resilient Data and AI Narratives
by:Andrew Cates


