 Global| Oct 31 2011
Japan Growth And The Yen
Summary
After three quarters of declines in GDP, an increase looks likely for Japan in the fourth quarter. Recovery is proceeding from the March Earthquake and Tsunami. Although industrial production fell by almost 4% in September from [...]
After three quarters of declines in GDP, an increase looks likely for
Japan in the fourth quarter. Recovery is proceeding from
the March Earthquake and Tsunami. Although industrial production
fell by almost 4% in September from August, the level of production in
manufacturing was 93% of the level (average of January and February)
reached prior to the March disasters.
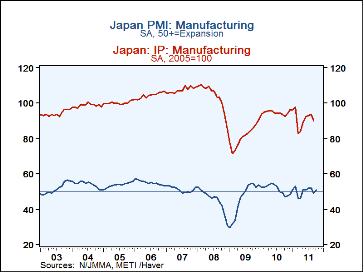
The Purchasing Managers Survey for Manufacturing in Japan rose above the 50 mark to 50.6307 in October from 49.3431 in September. The diffusion index for the Manufacturing PMI in Japan and the Industrial Production index are shown in the first chart.
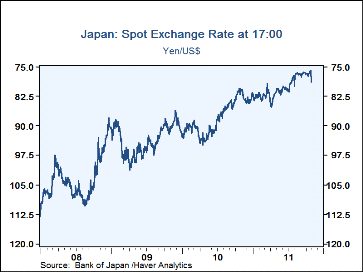
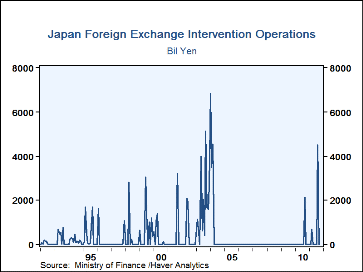
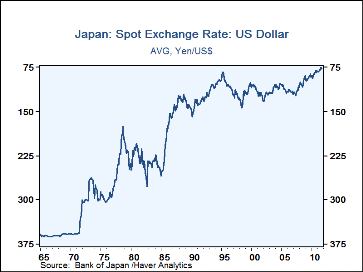
With so much of its economy dependent on exports, the major threat to growth in Japan comes from a strong and strengthening Yen. The second chart shows the recent strengthening in the yen. The yen reached an all time peak of 75.84 yen to the dollar on October 30. Part of the rise may have been due to the use of the yen as a haven from global developments, such as the Europe's sovereign debt crisis. In any case, Finance Minister Jun Alumni intervened forcibly in the market, causing a one day drop in the yen of 4.3%. Moreover, he vowed to continue selling the yen until he is "satisfied" with the results. The last intervention in the market took place in August of this year. The history of interventions is shown in the third chart.
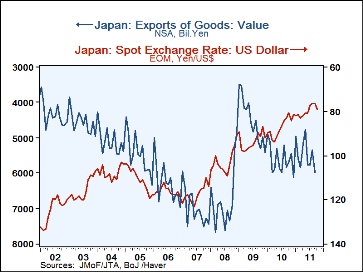
Until the financial crisis of 2008, rising productivity has helped Japan cope with a rising yen, as can be seen in the fourth chart, which shows a rising trend in exports at this same time that the yen strengthened. Since 2008, however, exports have risen more slowly than the exchange rate and for the last year or so have declined as the exchange rate has risen. As an indicator of the extent of overvaluation of the yen, Japanese exporters are currently saying that they could remain profitable if the yen were to trade at 86.30 to the dollar or weaker.
| Nov 11 |
Oct 11 |
Sep 11 |
Aug 11 |
Jul 11 |
Jun 11 |
May 11 |
Apr 11 |
Mar 11 |
Feb 11 |
Jan 11 |
|
|---|---|---|---|---|---|---|---|---|---|---|---|
| Fcst | Fcst | Actl | Actl | Actl | Actl | Actl | Actl | Actl | Actl | Actl | |
| Industrial Prod Total (2005=100) | -- | -- | 89.9 | 93.6 | 93.0 | 92.6 | 89.3 | 84.0 | 82.7 | 97.9 | 96.2 |
| Mfg Prod | -- | -- | 90.0 | 93.6 | 93.0 | 92.6 | 89.3 | 84.0 | 82.7 | 97.9 | 96.2 |
| % chng in Mfg | 1.8 | 2.3 | -3.85 | 0.65 | 0.43 | 3.70 | 6.31 | 15.7 | -15.53 | 1.77 | -0.10 |
More Economy in Brief
 Global| Feb 05 2026
Charts of the Week: Balanced Policy, Resilient Data and AI Narratives
by:Andrew Cates


