 Global| Mar 07 2011
Japan's Business Conditions Index
Summary
Japan's January business conditions indexes suggest that the Japanese economy has gained the momentum it appeared to have lost in the fourth quarter when the Gross Domestic Product fell by 1.1% on a seasonally adjusted annual rate. [...]
Japan's January business conditions indexes suggest that the Japanese economy has gained the momentum it appeared to have lost in the fourth quarter when the Gross Domestic Product fell by 1.1% on a seasonally adjusted annual rate.
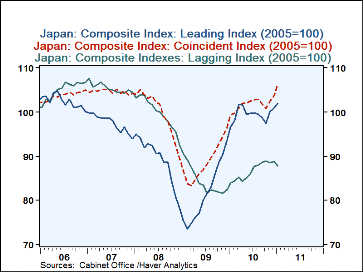
Japan's publishes two sets of indexes of leading, coincident and lagging indicators--composite and diffusion. The composite indexes measure the volume of overall business activity based on the percentage changes in twenty-nine selected indicators. Currently the base year for the index is 2005. The diffusion indexes measure the proportion of the indicators that are improving. If the proportion of indicators improving is more than 50%, the economy is expanding and if they are below 50%, the economy is contracting. Both the composite and the diffusion indexes are divided into leading, coincident and lagging indicators with the leading indicators based on 12 of the 29 selected indicators, the coincident, on 11 and the lagging, on six. The composite leading, coincident and lagging indicators are show in the first chart.
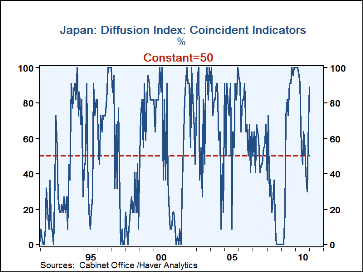
The coincident indexes, which indicate the level of current activity, were both up in January. The diffusion composite index was 88.9% in January, almost twice the level of the fourth quarter average of 47% and well above the 50% mark. Its rapid rise is shown in the second chart. The composite coincident index rose from an average of 102.3 in the fourth quarter to 106.2 in January, The leading indicators also increased, suggesting that the recent improvement in the economy is likely to continue. The composite leading index rose to 101.9 from an average of 99.5 in the fourth quarter and the diffusion leading index rose to 85.0% from an average of 42.4% in the fourth quarter of last year. The lagging indicators, by their very nature, tell us little of the present and future. They are used mainly in helping to date peaks and troughs of the business cycle.
| Jan 11 | Q4 10 | Dec 10 | Nov 10 | Oct 10 | Sep10 | Aug 10 | Jul 10 | |
|---|---|---|---|---|---|---|---|---|
| Composite Indexes (2005=100) | ||||||||
| Leading | 101.9 | 99.5 | 101.0 | 100.2 | 97.4 | 98.6 | 99.4 | 99.8 |
| Coincident | 106.2 | 102.3 | 103.7 | 102.4 | 100.7 | 101.8 | 102.9 | 102.7 |
| Lagging | 89.8 | 88.7 | 88.8 | 88.4 | 89.0 | 88.6 | 88.0 | 87.7 |
| Diffusion Indexes (%) | ||||||||
| Leading | 85.0 | 43.4 | 63.6 | 45.5 | 18.2 | 41.7 | 50.0 | 59.0 |
| Coincident | 88.9 | 46.7 | 70.0 | 30.0 | 40.0 | 54.5 | 63.6 | 45.5 |
| Lagging | 25.0 | 53.3 | 60.0 | 40.0 | 60.0 | 83.3 | 100.0 | 100.0 |
More Economy in Brief
 Global| Feb 05 2026
Charts of the Week: Balanced Policy, Resilient Data and AI Narratives
by:Andrew Cates


