 Global| Aug 07 2006
Japan's Business Cycle Indicators
Summary
The Japanese indexes of business conditions--the Diffusion Indexes and the Composite Indexes--are designed to facilitate the analysis of business cycles. The diffusion indexes aggregate the direction of changes of selected series to [...]

The Japanese indexes of business conditions--the Diffusion Indexes and the Composite Indexes--are designed to facilitate the analysis of business cycles. The diffusion indexes aggregate the direction of changes of selected series to detect a business cycle phase, while the composite indexes aggregate the percentage changes of selected series to detect the volume of output as an indication of the strength or weakness of the cycle.
Both the Diffusion and the Composite indexes are classified as Leading, Coincident and Lagging. The leading indicators are generally used as predictors. They usually precede the coincident indicators by a few months. The lagging indicators are used to confirm turning points.
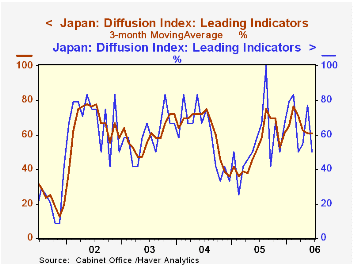
As reported, the diffusion indexes are extremely volatile. For instance, the latest report for the leading diffusion index is 50% for June, down from 77.3% in May. If we take, instead, a three month moving average, the June figures is 60.6% or the same as May. (See the first chart which shows the monthly values of the leading diffusion index and the three months moving averages.) A value of a diffusion index above 50% indicates expansion while a value below indicates a contraction. The President of the ESRI (Economic and Social Research Institute) has determined that the current cycle is dated from the trough of the last cycle--January, 2002. Thus the current expansion has been in progress for 43 months. With the leading indicator steady and the coincident and lagging diffusion indexes still showing strength, the expansion is likely to continue, for a few months, at least. The longest expansion on record is that from October, 1965 to July, 1970 a total of 57 months.
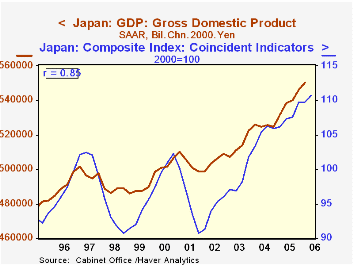
The composite leading indicator also declined in June from 108.2 (2000=100) in May to 106.2. but the three month moving average for June was 107.3, compared with 106.5 in May. The coincident composite index is also an indicator of the phase of the cycle. If it is rising (falling), the economic cycle is considered to be in the expansion (contraction) phase. In addition, the quarterly average of the composite coincident index is a good indicator of real gross domestic product as shown in the second chart. (The correlation between the two is .85.) Thus rise in the composite coincident index suggests a continued rise in real GDP for the second quarter. The first estimate of the second quarter GDP is expected on August 11.
| Japan | Jun 06 | May 06 | Jun 05 | M/M | Y/Y | 2005 | 2004 | 2003 |
|---|---|---|---|---|---|---|---|---|
| Diffusion Indexes (%) | ||||||||
| Leading Indicators | 50.0 | 77.3 | 58.3 | -27.3 | -8.3* | 55.2 | 59.4 | 59.7 |
| Coincident Indicators | 88.9 | 80.0 | 100.0 | 8.9 | -11.1* | 71.6 | 61.4 | 74.6 |
| Lagging Indicators | 75.0 | 80.0 | 83.3 | -5.0 | -8.2* | 72.2 | 77.8 | 68.8 |
| Composite Indicators (2000=100) | ||||||||
| Leading Indicators | 106.2 | 108.2 | 102.5 | -1.94 | 3.71 | 102.8 | 103.1 | 96.9 |
| Coincident Indicators | 111.2 | 110.3 | 107.6 | 0.82 | 3.35 | 107.7 | 105.2 | 98.5 |
| Lagging Indicators | 124.0 | 125.3 | 120.7 | -1.04 | 2.73 | 119.8. | 114.2 | 103.3 |


