 Global| Jun 08 2010
Japan's Current Account Balance And Trade In Goods
Summary
Japan's seasonally adjusted current account balance, reported today, declined 393.5 billion yen from 1,773.1 billion yen in March to 1,379.6 billion yen in April. There has however been strong uptrend in the balance since the low [...]
 Japan's seasonally adjusted
current account
balance, reported today, declined 393.5 billion yen from 1,773.1
billion yen in March to 1,379.6 billion yen in April. There has however
been strong uptrend in the balance since the low point of 527.9 billion
yen reached in January 2009. The unseasonally adjusted data
show an 88% increase from 660.6 billion yen in April, 2009 to 1,242.1
billion yen, in April 2010.
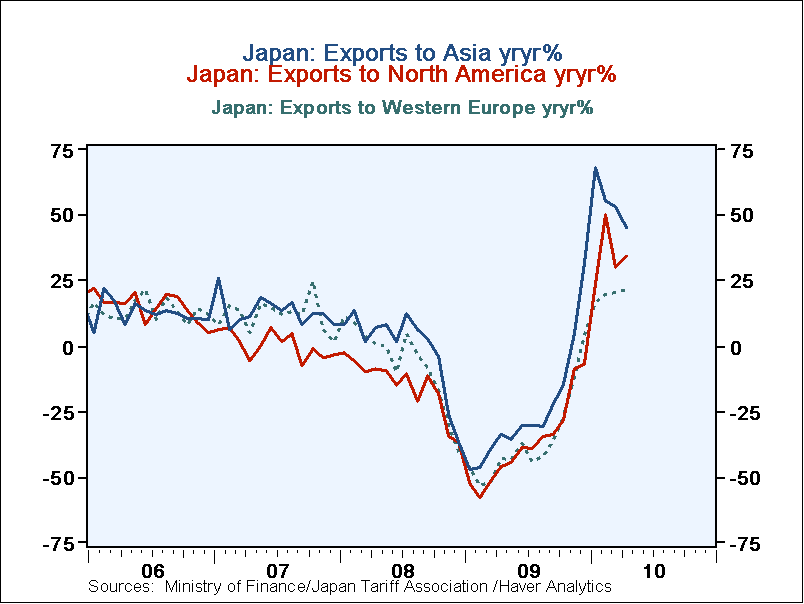
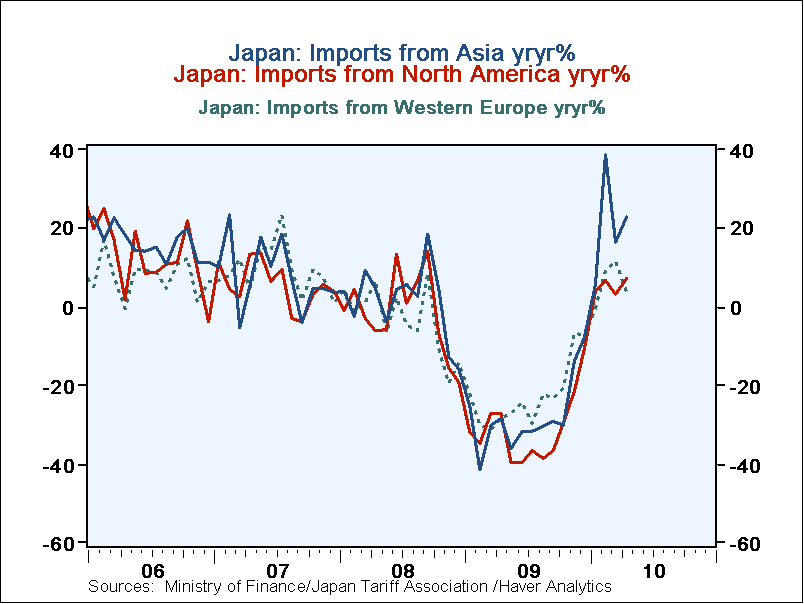
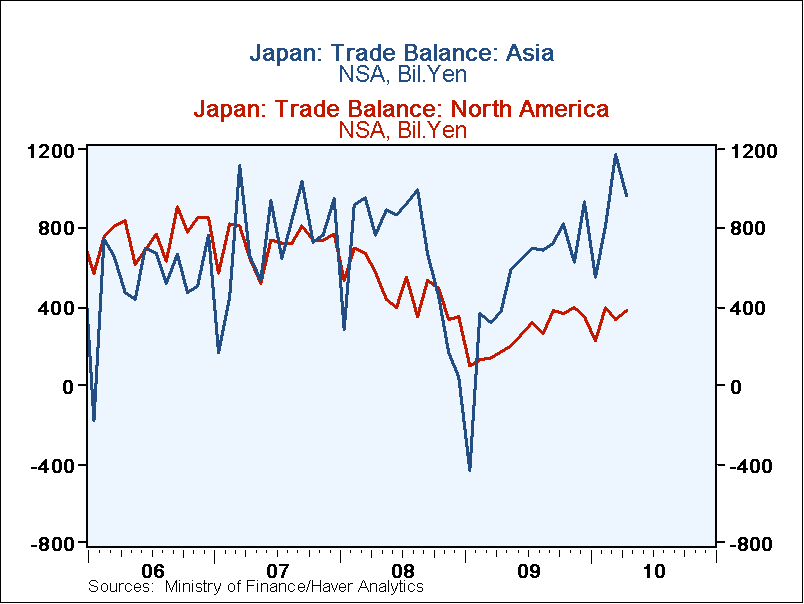
Much of the improvement in the recovery of the current account balance is due to an increase in the trade balance. Japanese exports increased 40.4% from April, 2009 to April, 2010 while imports increased 24.6%. The first two charts show the year to year percent increases in exports to North America, mainly the U. S., Western Europe and Asia, mainly China, and in imports from those same three broad areas. Over the past five years, Japanese exports to, and imports from imports from, Asia have generally risen faster than those to North America and Western Europe. Until late 2008 and early 2009, Japanese exports to Asia fluctuated between 45 and 51% of total exports. In mid 2009, exports to Asia began to accelerate and in March and April of this year, they accounted for more than 56% of total exports. There was no corresponding jump in the percent of imports from Asia. The resulting rise in Japan's balance on trade in goods with Asia has been accompanied by a decline in Japan's trade surplus with North America as can be seen in the third chart.
| JAPAN | Apr 10 | Mar 10 | Apr 09 | Y/Y % | Y/Y Bil Yen Chg |
2009 | 2008 | 2007 |
|---|---|---|---|---|---|---|---|---|
| Current Account Balance (SA) (Billion Yen) | 1379.6 | 1773.1 | 848.8 | 62.5 | 530.8 | 13289 | 16549 | 24688 |
| Current Account Balance (NSA) (Billion Yen) | 1242.1 | 2534.2 | 660.6 | 88.1 | 581.5 | 13287 | 16380 | 24794 |
| Exports (Billion Yen) | 5887.9 | 6003.6 | 4194.9 | 40.4 | 1693.2 | 54171 | 81018 | 83931 |
| North America | 951.9 | 940.3 | 708.6 | 34.3 | 243.3 | 9456 | 15331 | 18135 |
| Western Europe | 702.8 | 683.6 | 576.8 | 21.8 | 126.0 | 7077 | 11445 | 12329 |
| Asia | 3323.5 | 3380.4 | 2287.9 | 45.2 | 1036.6 | 29333 | 39966 | 40401 |
| Imports (Billion Yen) | 5147.4 | 5053.7 | 4145.7 | 24.6 | 1001.6 | 51499 | 78955 | 73136 |
| North America | 573.4 | 606.0 | 534.8 | 7.21 | 38.6 | 6378 | 9371 | 9530 |
| Western Europe | 493.3 | 590.0 | 475.5 | 3.75 | 17.8 | 6137 | 7999 | 8299 |
| Asia | 2353.9 | 2203.6 | 1915.5 | 22.9 | 43.8 | 22989 | 32034 | 31564 |
More Economy in Brief
 Global| Feb 05 2026
Charts of the Week: Balanced Policy, Resilient Data and AI Narratives
by:Andrew Cates


