 Global| Feb 13 2012
Japan's Q4-11 Gross Domestic Product Disappoints
Summary
The preliminary estimate of a 3.0 billion annual rate decline in chained 2005 yen(-2.3% annual rate) in Japan's fourth quarter gross domestic product from the third quarter was greater than expected. During the quarter private and [...]
The preliminary estimate of a 3.0 billion annual rate decline in chained 2005 yen(-2.3% annual rate) in Japan's fourth quarter gross domestic product from the third quarter was greater than expected. During the quarter private and public consumption increased 1.2 billion chained 2005 yen, gross fixed capital formation by 1.6 billion chained 2005 yen and a decline in imports of goods and services led to an increase of 0.7 billion chained 2005 yen. Offsetting these increases was a decline of 2.7 billion chained 2005 yen in the exports of goods and services, due to the rising yen and the slowdown in global demand. The greater than expected decline may have been due to a bigger than expected inventory liquidation. Data on inventories are not given in the preliminary release. However, there is an implied change in inventories that can be calculated by subtracting the given components from the given total. (The historical data may show small differences between the calculated and reported figure due to rounding.) The preliminary data show there was a sizeable implicit decline of 4.1 billion chained 2005 yen in the fourth quarter. Inventories have declined throughout the year by some 14 billion chained 2005 yen due, in large part, to the disruptions caused by the earthquake and tsunami early in the year and the floods in Thailand later in the year. The size of the liquidation suggests that the need to replenish stocks could add to domestic demand next year.
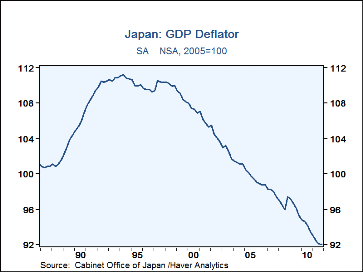
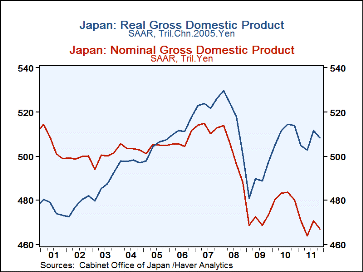
It is now almost two decades during which Japan has struggled with deflation. as can be seen in the attached charts. The first shows the official deflator for the gross domestic product, which is seasonally unadjusted, adjusted by the Haver seasonal adjustment function and the second shows gross national product on a nominal and a real basis. Recently the Governor of the Bank of Japan, Masaaki Shirakawa, attributed the "severe" condition of the Japanese economy to deflation and the gains in the yen but made no reference to a more expansive monetary stance. However, pressure for such a more a policy change and the need to improve the Central Bank's communication is rising. The Economy Minister, Motohisa Furukawa suggested that the Central Bank should improve its communication on its stance on prices.
| GDP (Bil Chained 2005 Yen) | Q4-11 | Q3-11 | Q2-11 | Q1-11 | Q/Q % | Y/Y % | 2011 | 2010 | 2009 | 2008 |
|---|---|---|---|---|---|---|---|---|---|---|
| Nominal GDP | 467.1 | 470.8 | 463.9 | 4704.7 | -3.1 | -2.7 | 468.1 | 481.8 | 471.0 | 501.0 |
| Real GDP | 508.4 | 511.4 | 502.8 | 504.7 | -2.3 | -1.0 | 506.8 | 511.2 | 489.3 | 518.0 |
| Pvt Cons | 302.4 | 301.5 | 298.1 | 297.5 | -- | -- | 299.9 | 299.9 | 292.5 | 294.3 |
| Govt Cons | 100.1 | 99.7 | 99.5 | 98.7 | -- | -- | 99.5 | 97.5 | 95.5 | 93.3 |
| Gross Fixed Capital Formation | 98.9 | 98.3 | 99.1 | 97.1 | -- | -- | 98.1 | 98.1 | 98.2 | 109.6 |
| Exports of Gds & Services | 82.4 | 85.0 | 78.3 | 83.5 | -- | -- | 82.3 | 82.3 | 66.1 | 87.5 |
| Imports of Gds & Services | 70.9 | 70.2 | 67.9 | 67.7 | -- | -- | 69.2 | 65.3 | 58.8 | 69.8 |
| Chg in Inventories | -4.1 | -2.3 | -3.7 | -3.7 | -- | -- | 14.0 Est |
1.3 | -4.8 | 2.8 In add |
More Economy in Brief
 Global| Feb 05 2026
Charts of the Week: Balanced Policy, Resilient Data and AI Narratives
by:Andrew Cates


