 Global| Mar 09 2009
Japan Starts 2009 with a CurrentAccount Deficit
Summary
Japan recorded a current account deficit in January of $172.8 billion yen, due largely to the collapse in exports. Exports of goods declined by 1309.6 billion yen in January and were 2830.6 billion yen below a year ago. Imports [...]

Japan recorded a current account deficit in January of $172.8
billion yen, due largely to the collapse in exports. Exports of goods
declined by 1309.6 billion yen in January and were 2830.6 billion yen
below a year ago. Imports declined 663.2 billion yen in January and
were 1914.9 billion yen below January, 2008. The resulting deficit on
goods was 844.4 billion yen in January, compared with 197.9 billion yen
in December and a surplus of 71.3 in January, 2008. The balance between
income from foreign sources and payments to these sources increased
from 924.2 billion yen in December to 992.4 billion yen in January but
was substantially below the 1,448.4 billion yen of January, 2009. The
deficit on services in January was 255.8 billion yen, little changed
from the 251.6 billion yen of a year ago. The deficit on current
transfers was 65.0 billion yen, down from the 104.4 deficit of January
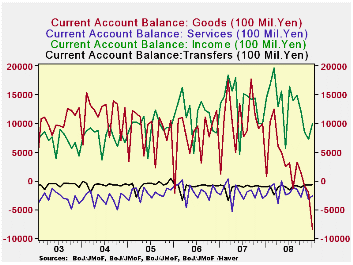
2008. The first chart shows the importance of the recent decline in the
balance on goods in the decline of the current account.
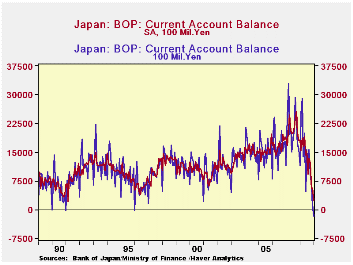
January is typically a low month for the current account balance, as can be seen in the second chart, which shows both the seasonally unadjusted and adjusted data. After seasonal adjustment, the data for the current account show a surplus of 259.0 billion yen for January. This surplus is, however, the lowest recorded since the early nineties, as can be seen in the second chart, just as the deficit in the unadjusted data was the highest.
| JAPAN CURRENT ACCOUNT (100 Mil Yen) | Jan 09 | Dec 08 | Jan 08 | M/M CHG | Y/Y CHG | 2008 | 2007 |
|---|---|---|---|---|---|---|---|
| Total NSA | -1728 | 1254 | 11637 | -2982 | -13365 | 162802 | 247938 |
| Goods | -8444 | -1929 | +713 | -6465 | -9157 | 40337 | 123225 |
| Exports | 32822 | 45920 | 61128 | -13096 | -28306 | 773522 | 797254 |
| Imports | 41266 | 47266 | 60415 | -6632 | -19149 | 733183 | 674030 |
| Services | -2558 | -3217 | -2516 | 659 | -42 | -22366 | -24971 |
| Income | 9924 | 7242 | 14484 | 2682 | -4560 | 158324 | 163267 |
| Current Transfers | -650 | -793 | -1044 | 143 | 394 | -13497 | -13580 |
| Total SA | 2580 | 5570 | 18059 | -2990 | -15478 | 162599 | 250661 |
by Robert Brusca March 9 2009

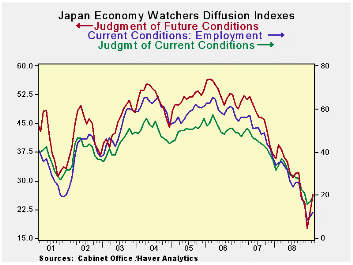
Japan’s economy watchers index is making further tentative
signs of rebounding from its very deep cyclical lows in this cycle. The
future index has made a more substantial bounced higher, but the
current index is rising too. The future index is still in the bottom
22% of its five year range. The headline index is only in the 8.5%
percentile of its range. But any improvement begins from where you are.
In December each of these measures was at a five year low. So this is
what the early signs of progress look like. It is too soon to take the
positive moves in these signs to the bank. But I think we have been
very oversold in markets and that commentators have been pessimistic
beyond what prudence would call for. Japan’s early signs join some from
the US that say conditions are not now getting worse. This may well be
among the first tentative steps on the road to eventual recovery.
| Key Japanese surveys | |||||||
|---|---|---|---|---|---|---|---|
| Raw readings of each survey | Percent of 5Yr range* | ||||||
| Diffusion | Feb-09 | Jan-09 | Dec-08 | Nov-08 | Feb-09 | Jan-09 | Dec-08 |
| Economy Watchers | 19.4 | 17.1 | 15.9 | 21.0 | 8.5% | 2.9% | 0.0% |
| Employment | 11.9 | 10.1 | 8.5 | 15.7 | 5.9% | 2.8% | 0.0% |
| Future | 26.5 | 22.1 | 17.6 | 24.7 | 22.8% | 11.5% | 0.0% |
| NTC MFG | 31.6 | 29.6 | 30.8 | 36.7 | 7.0% | 0.0% | 0.0% |
| Econ Trends (Teikoku'/50 neutral/weighted diffusion) | |||||||
| MFG | 17.0 | 17.7 | 19.3 | 24.5 | 0.0% | 0.0% | 0.0% |
| Retail | 20.5 | 21.6 | 21.3 | 24.4 | 0.0% | 1.5% | 0.0% |
| Wholesale | 18.4 | 19.0 | 20.4 | 24.7 | 0.0% | 0.0% | 0.0% |
| Services | 22.6 | 23.3 | 24.1 | 28.4 | 0.0% | 0.0% | 0.0% |
| Construction | 18.2 | 18.6 | 19.1 | 21.4 | 0.0% | 0.0% | 0.0% |
| 100 is high; Zero is low | |||||||
More Economy in Brief
 Global| Feb 05 2026
Charts of the Week: Balanced Policy, Resilient Data and AI Narratives
by:Andrew Cates


