Global| Aug 13 2007
Japan: Will the BOJ Raise Rates in the Face of a Bigger than Expected Drop in Real GDP and Only Little Progress on [...]
Summary
On July 12, Toshihiko Fukui, Governor of the Bank of Japan said that slow growth in the second quarter would not determine the outcome of the August 22 and 23 monetary policy meeting. However, the unexpectedly big slowdown in real [...]
On July 12, Toshihiko Fukui, Governor of the Bank of Japan said that slow growth in the second quarter would not determine the outcome of the August 22 and 23 monetary policy meeting. However, the unexpectedly big slowdown in real GDP, from a revised 3.2% annual rate in the first quarter to 0.5% annual rate in the second quarter may weaken his resolve to raise the key overnight lending rate from 0.5%.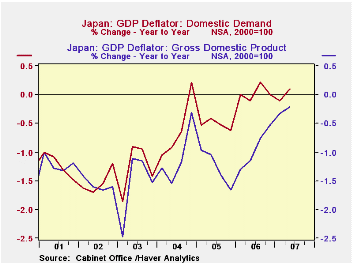
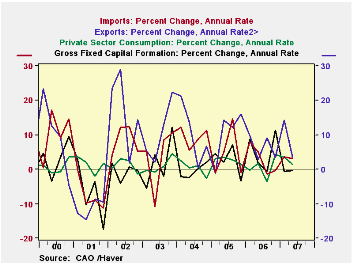
The disappointing report was the result of a decline in fixed capital formation, a deceleration in net exports of goods and services and private consumption. In addition, private sector inventories declined in the second quarter. The changes in the major components of real GDP are shown in the first chart.
While the GDP report gives little support for a rise in interest rates a determined BOJ could cite the rise in deflator for domestic demand, the preferred measure of inflation.The second chart shows the year to year changes in the total GDP deflator and those in the Domestic Demand Deflator. The total deflator has yet to show a year to year increase but the domestic demand deflator rose 0.1% in the second quarter, the third positive showing over the past seven years. Even so this hardly constitutes strong evidence that inflation is a near term threat.
| Japan Gross Domestic Product | Q2 07 | Q1 07 | Q2 06 | Q/Q Chg | Y/Y Chg | 2006 | 2005 | 2004 |
|---|---|---|---|---|---|---|---|---|
| Real GDP (Trillion 2000 Chained Yen | 560.2 | 559.4 | 547.5 | 0.54 | 2.31 | 548.9 | 537.2 | 527.3 |
| Current GDP (Trillion Yen) | 516.7 | 515.3 | 506.7 | 1.05 | 2.04 | 507.7 | 501.4 | 498.5 |
| Components of Real GDP | ||||||||
| Private Consumption (Trillion 2000 Chained Yen) |
309.2 | 308.1 | 305.2 | 1.41 | 1.31 | 304.2 | 301. | 297.1 |
| Fixed Capital Formation (Trillion 2000 Chained Yen) |
130.0 | 130.1 | 127.0 | -0.39 | 2.36 | 127.6 | 123.4 | 120.5 |
| Exports of Goods and Services (Trillion 2000 Chained Yen) |
85.7 | 85.0 | 79.7 | 3.47 | 7.55 | 80.6 | 73.5 | 68.8 |
| Imports of Goods and Services (Trillion 2000 Chained Yen) |
61.6 | 61.1 | 60.8 | 3.10 | 1.21 | 60.5 | 57.9 | 54.7 |
| Deflators (2000=100) | ||||||||
| Total | 93.7 | 91.0 | 93.9 | -- | -0.21 | -- | -- | -- |
| Domestic Demand | 96.4 | 93.3 | 96.3 | -- | 0.10 | -- | -- | -- |
by Tom Moeller August 13, 2007
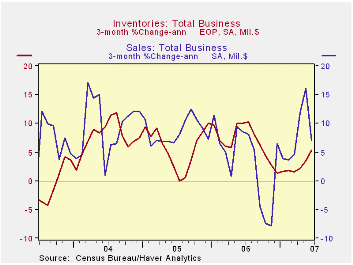
Retail inventories rose 0.5% after the May gain of 0.7%. Auto inventories led the June gain and jumped 1.0% after moderate increases during the prior three months that were upwardly revised. General merchandise inventories increased 0.2% (6.5% y/y), half the May gain of 0.4% but clothing store inventories fell 0.2% (+6.7% y/y) after a 0.4% May gain that was revised down. Furniture inventories reversed the prior month's decline with a 0.6% (0.2% y/y) rise. 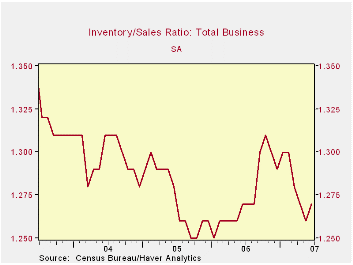
The inventory to sales ratio ticked up, off its low level during the prior month.
| Business Inventories | June | May | Y/Y | 2006 | 2005 | 2004 |
|---|---|---|---|---|---|---|
| Total | 0.4% | 0.5% | 3.6% | 5.9% | 6.2% | 7.9% |
| Retail | 0.5% | 0.7% | 1.3% | 3.2% | 2.8% | 6.8% |
| Retail excl. Autos | 0.2% | 0.7% | 4.0% | 4.5% | 4.5% | 7.2% |
| Wholesale | 0.5% | 0.5% | 6.3% | 8.6% | 7.4% | 9.7% |
| Manufacturing | 0.3% | 0.4% | 3.7% | 6.4% | 7.9% | 7.7% |
by Robert Brusca August 13, 2007
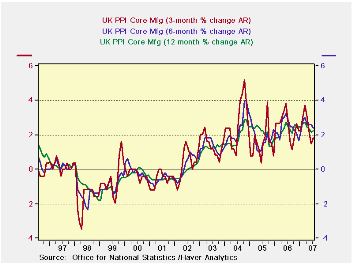
PPI trends in the UK have gone essentially flat. Compared to a year ago the Y/Y pace is slightly lower and the recent 3-month and 6-month paces have been moderate but still above the point that the BOE (and the Fed and the ECB) regard as price stability. There does not seem to be any special problem in the making but inflation is hovering in the 2% to 2.5% range instead of the 1.5% to 2% range where the BOE would be more content. This does not seem to be actionable discrepancy nor is the PPI the rate that would be the deciding one for the BOE. The report was a touch on the high side but not a bad one.
| M/M % Change | % Change-SAAR | ||||||
| Jul-07 | Jun-07 | May-07 | 3-mo | 6-mo | 12-mo | 12-moY-Ago | |
| MFG | 0.2% | 0.4% | 0.4% | 3.6% | 3.6% | 2.4% | 2.9% |
| Core | 0.2% | 0.1% | 0.2% | 1.8% | 2.4% | 2.2% | 2.5% |
| Core: ex food beverages, tobacco & Petroleum | |||||||
by Tom Moeller August 13, 2007
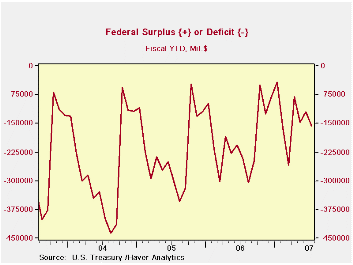
U.S. net outlays grew 2.9% during this fiscal year's first ten months. Defense spending (19% of total outlays) grew 6.3% and Medicare expenditures (12% of outlays) surged by14.4%. Social security spending (21% of outlays) rose 5.7% but the government's interest expense rose by 5.1% y/y. Holding back the overall gain in expenditures were large declines in spending on energy and agriculture as well as a 3.0% decline in spending on international affairs and a 7.9% drop in spending on natural resources & environment.
| US Government Finance | July | June | Y/Y | FYTD 2007 | FY 2006 | FY 2004 |
|---|---|---|---|---|---|---|
| Budget Balance | $-36.3B | $27.5B | $-33.2B (7/06) |
-$247.7 | -$318.7B | -$412.7B |
| Net Revenues | $170.4B | $276.5B | 6.7% | 7.5% | 11.8% | 14.6% |
| Net Outlays | $206.8B | $249.0B | 7.2% | 2.5% | 7.4% | 7.8% |
by Tom Moeller August 13, 2007
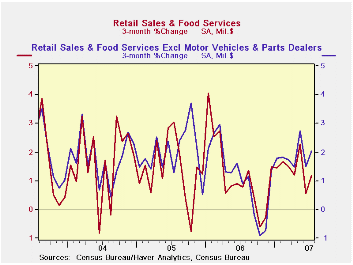
U.S. retail sales in July rose 0.3% after a 0.7% decline in June that was revised slightly shallower versus the initial report. The July figure compared with Consensus expectations for a 0.1% decline.
Excluding autos, retail sales rose 0.4% and more than reversed a 0.2% June decline that also was revised slightly shallower.The July increase was double Consensus expectations for a 0.2% increase.Nonauto retail sales less gasoline rose 0.6% (5.2% y/y) after an unchanged June reading that was revised up from a 0.3% decline reported at first.
Sales of discretionary items were generally firm last month. Furniture, home furnishings & appliance stores recovered 0.8% (1.6% y/y of a 1.2% June decline that was half the shortfall initially estimated. Sales at general merchandise stores rose 0.9% (6.0% y/y) after rising a little revised 0.4% during the prior month.Apparel store sales rebounded 1.3% (5.8% y/y) following a 1.2% June drop that was little revised.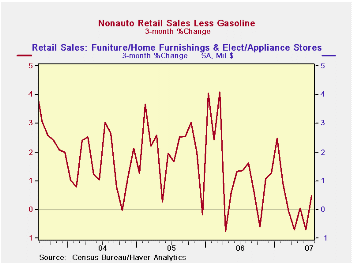
Building material sales during July rose 0.2% (0.4% y/y) but recovered just a piece of the prior month's little revised 2.2% plunge. Sales of nonstore retailers (internet & catalogue) rose 0.4% (7.3% y/y) after June's downwardly revised 0.6% increase and July restaurant & bar sales jumped 1.3% (8.0% y/y), double the prior month's rise.
Sales by motor vehicle & parts dealers fell 0.3% (-1.2% y/y) as unit sales of new vehicles fell 2.6% m/m in July.
Gasoline service station sales fell 0.8% reflecting a 3.0% m/m decline in gas prices at the pump to an average $2.97 per gallon (-0.5% y/y).
| July | June | Y/Y | 2006 | 2005 | 2004 | |
|---|---|---|---|---|---|---|
| Retail Sales & Food Services | 0.3% | -0.7% | 3.2% | 6.2% | 6.6% | 6.1% |
| Excluding Autos | 0.4% | -0.2% | 4.4% | 7.3% | 7.6% | 7.1% |
More Economy in Brief