 Global| Mar 19 2007
Japanese Department Store Sales And Total Consumer Spending
Summary
February department store sales in Japan, which are not seasonally adjusted, were 1.15% above those of February 2006, the highest year to year increase since last March. While the year to year increase is reassuring, it does not [...]

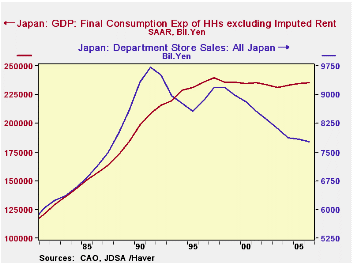
February department store sales in Japan, which are not seasonally adjusted, were 1.15% above those of February 2006, the highest year to year increase since last March. While the year to year increase is reassuring, it does not necessarily tell us much about the course of total consumer spending. Until the late nineties, department store sales were a good indicator of the direction of total consumer spending, as can be seen in the first chart. (We have used the "Final Consumption of Households excluding Imputed Rent" series in the National Account as the measure of total consumer spending.) Since then, however, department store sales have trended downward while total consumer spending has continued to rise.
In addition to department store sales, Japan publishes information on sales at all retail establishments, at large scale department stores, supermarkets, chain stores and convenience stores.
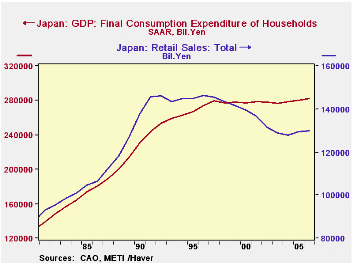
It is not only department store sales that no longer indicate the trend of total consumer spending, but sales at all retail establishments. The second chart comparing retail sales and total consumer spending shows the same general trends as those of department store sales and total consumer spending. Consumers are spending more on such services, as education, health, transportation, leisure activities that cannot be supplied by retail establishments.
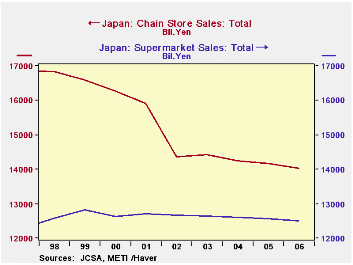
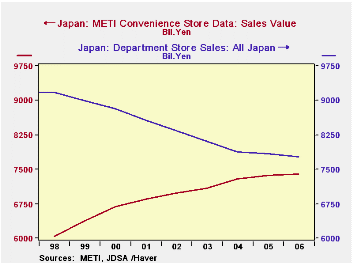
While the wealth of retail sales data that Japan publishes may have little use as a reliable indicator of total consumer spending, the data are useful in tracking consumer buying habits. As noted above, consumers are using department stores less. Consumer purchases at chain stores fell sharply from the late 90's to 2002, and have been more or less constant since then. Supermarket sales have varied only slightly over the past nine years, as can be seen in the third chart that compares sales at chain stores and supermarkets. The brightest spot in the retail area has been the convenience store. Though still smaller than department store sales, convenience store sales are the only area where significant growth is apparent. The fourth chart compares, convenience store sales with department store sales over the past nine years.

| Consumer Spending in Japan | Feb 07 | Jan 07 | Dec 06 | 2002 Bil Yen | 2006 Bil Yen | 2006 % | 2005 % | 2004 % |
|---|---|---|---|---|---|---|---|---|
| Private HH Consumption ex rent | n.a. | n.a. | n.a. | 277,709 | 235,531 | 0.40 | 0.59 | 0.86 |
| Retail Sales | n.a. | -0.89 | -0.17 | 131,413 | 129,785 | 0.20 | 1.12 | -0.60 |
| Large Scale Department Store Sales | n.a. | -0.74 | -2.86 | 9,365 | 8,644 | -1.36 | -1.02 | -2.78 |
| Supermarkets | n.a. | 1.37 | -0.63 | 12,653 | 12,504 | -0.49 | -1.38 | -1.31 |
| Department Stores Sales | 1.15 | -0.39 | 2.65 | 8,112 | 7,770 | -0.91 | -0.47 | -2.87 |
| Chain Store Sales | n.a. | -0.53 | -1.99 | 14,370 | 14,022 | -1.08 | -0.54 | -1.20 |
| Convenience Store Sales | n.a. | 1.68 | 2.20 | 6,980 | 7,399 | 0.54 | 0.97 | 2.72 |


