 Global| Mar 01 2005
Japanese Economic Outlook Still Cloudy--Much New Data Notwithstanding
Summary
Today's releases of data on production, sales, employment and survey results for Japan have failed to clear the cloudy outlook. Industrial production for manufacturing increased 2% in January from December, but the Ministry of [...]

Today's releases of data on production, sales, employment and survey results for Japan have failed to clear the cloudy outlook.
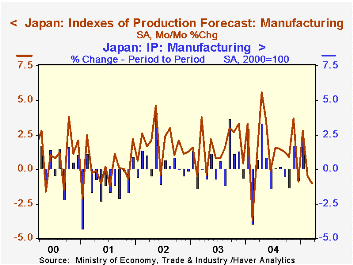
Industrial production for manufacturing increased 2% in January from December, but the Ministry of Economy, Trade and Industry (METI)'s survey forecast a decline of 0.5% for Februaryand one of 1.0% for March. Although the forecasts (found in the Industrial Production Section of Haver's Japan data base) tend to overestimate the magnitudes of the changes, they do a good job in predicting the direction of the change, as can be seen in the first chart.
Retail sales were up 5.71% in January over December and 1.66% above January of a year ago. The magnitude of the January increase may merely be a bounce back from the depressed sales at the end of 2004, due, in part to the negative effect of unusual weather conditions--earthquakes and the tsunami--on sales in the latter part of 2004. The unemployment rate held steady at 4.5% in January and employment increased 0.74%. The Household Survey conducted by the Ministry of Internal Affairs and Communication shows a sharp rise of 11.52% in disposable income of worker households in January, but again this appears to be bounce back from the sharp decline in December. A similar, but more muted trend is shown in Living Expenditures of these households.
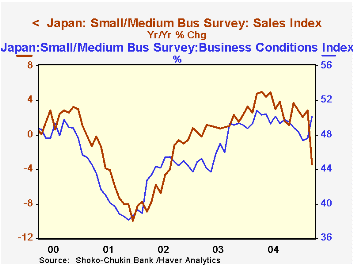
The Shoko Chukin Small/Medium Firm Survey indicates that these firms were expecting some improvement in business conditions in February and March, but were forecasting a decline in sales, the first decline since December 2002.The mixed message of these data is shown in chart two.
| Jan 05 M/M % |
Dec 04 M/M % |
Nov 04 M/M % |
Oct 04 M/M % |
Y/Y % | 2004 | 2003 | 2002 | |
|---|---|---|---|---|---|---|---|---|
| Industrial Production Mfg (2000=100) | 2.10 | -0.79 | 1.72 | -1.29 | 1.09 | 100.1 | 95.1 | 92.0 |
| Retail Sales (2000=100) | 5.71 | -0.76 | -0.46 | 0.33 | 2.23 | 91.7 | 92.5 | 94.1 |
| Employment | 0.74 | 0.27 | -0.33 | -0.24 | 0.65 | 6.3 mil | 6.3 | 6.3 |
| Unemployment Rate | 4.5 | 4.5 | 4.6 | 4.6 | -0.5 | 4.7 | 5.2 | 5.4 |
| Household Survey | ||||||||
| Disposable Income | 11.52 | -9.21 | 0.53 | -1.45 | 0.73 | 94.6 | 93.3 | 95.8 |
| Living Expenditures | 7.70 | -2.40 | 0.42 | 0.21 | 2.55 | 97.1 | 95.6 | 97.0 |
| Small/Medium Firm Survey | Mar 05 | Feb 05 | Jan 05 | Dec 04 | 2004 | 2003 | 2002 | |
| Business Conditions Per cent Better-Worse | 50.2 | 47.6 | 47.3 | 48.4 | 49.6 | 46.4 | 43.5 | |
| Sales Y/Y % | -3.4 | 2.8 | 2.1 | 2.8 | n.a. | n.a. | n.a. | |
| Industrial Production Forecast | -1.0 | -0.5 | 2.8 | -0.9 | 1.5% | 1.6% | 1.8% |


