 Global| Nov 07 2006
Japanese Household Living Expenditures Decline Sharply: Implications for 3rd Q GDP?
Summary
By the many measures of family living expenditures the Ministry of Internal Affairs and Communications publishes, Japanese families have been reducing their living expenditures. The index of living expenditures for all households in [...]

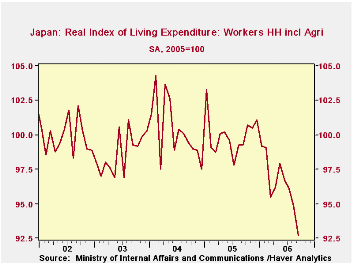
By the many measures of family living expenditures the Ministry of Internal Affairs and Communications publishes, Japanese families have been reducing their living expenditures. The index of living expenditures for all households in Japan declined 2.8% in September. Those of worker households declined 3.35%. On seasonally adjusted bases, all households reduced spending on average in September by 1.97% in real terms and 2.16% in nominal terms.Comparable declines for the worker households were 2.42% and 2.32%. The September declines have, in most cases followed declines in August and July. The first chart showing the seasonally adjusted real living expenditure by all households is illustrative of declines in the various measures of household living expenditures over the recent quarter. In addition to the various indexes, data in yen are also available.
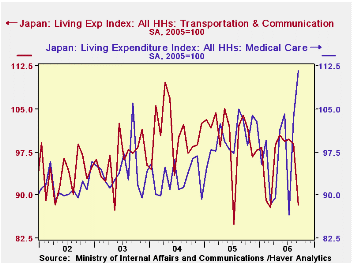
The seasonally unadjusted data give details of the composition of expenditures. For example, in September, expenditures on food, fuel, light and water charges, medical care, education and culture all rose while expenditures on housing, furniture and household utensils, clothing and foot ware, transportation and communication and miscellaneous all declined. The second chart shows expenditures on medical care and transportation,
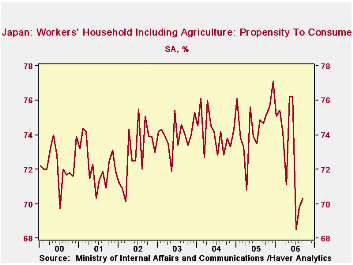
In addition to the seasonally adjusted data on expenditures, data are also available on income, disposable income and the propensity to consume. The propensity to consume for all households increased in August and September, in spite of the decline in expenditures since the decline in disposable income was greater than the decline in living expenditures. Even with the rise, the propensity to consume is still at a historically low level as can be seen in the third chart.
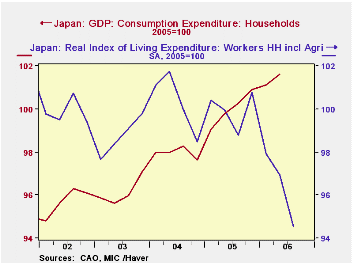
One would think that the living expenditure series might be a good indicator of consumer spending in the national accounts. The relationship, however, appears tenuous as can be seen in the fourth chart that compares the seasonally adjusted real living expenditures of all households with final consumption expenditures in GDP. Nevertheless, the recent trend in the real living expenditures looks ominous. (To compare the two series, we aggregated the monthly data of the living expenditure series on a quarterly basis and we put the Consumption data on an index with the same basis--(2005=100)--as the living expenditure series.
| Japan: Family Living Expenditures (2005=100) | Sep 06 | Aug 06 | Sep 05 | M/M % | Y/Y % | 2005 | 2004 | 2003 |
|---|---|---|---|---|---|---|---|---|
| All Households NSA | 94.0 | 96.7 | 100.3 | -2.79 | -6.28 | 100.0 | 100.1 | 99.6 |
| Worker Households NSA | 92.3 | 95.5 | 99.2 | -3.35 | -6.96 | 100.0 | 99.8 | 98.5 |
| All Household SA | -- | -- | -- | -- | -- | -- | -- | -- |
| Real | 94.5 | 96.4 | 100.5 | -1.97 | -5.97 | 100.0 | 100.5 | 100.0 |
| Nominal | 95.2 | 97.3 | 100.5 | -2.16 | -5.27 | 100.0 | 100.8 | 100.4 |
| Worker Household SA | -- | -- | -- | -- | -- | -- | -- | -- |
| Real | 92.7 | 94.9 | 99.3 | -2.32 | -6.65 | 100.0 | 100.3 | 98.7 |
| Nominal | 93.2 | 95.5 | 99.1 | -2.41 | -5.95 | 100.0 | 100.7 | 99.1 |
| Propensity to Consume All HH (Nominal SA)(%) | 70.3 | 69.8 | 74.7 | 0.5* | -4.4* | 74.5 | 74.1 | 74.0 |


