Global| Oct 12 2009
JOLTS: U.S. Job Openings Fell To New Low, Off One-Third From Last Year
by:Tom Moeller
|in:Economy in Brief
Summary
For August, the Bureau of Labor Statistics reported in its Job Openings & Labor Turnover Survey (JOLTS) that job availability fell to a new series' low in August. The 0.9% downtick in the number of job openings followed a 4.2% July [...]
 For
August, the Bureau of Labor Statistics reported in its Job Openings
& Labor Turnover Survey (JOLTS) that job availability fell to a
new series' low in August. The 0.9% downtick in the number of
job openings followed a 4.2% July decline and openings were
off by 35.9% from last August. The series dates back to December
2000.
For
August, the Bureau of Labor Statistics reported in its Job Openings
& Labor Turnover Survey (JOLTS) that job availability fell to a
new series' low in August. The 0.9% downtick in the number of
job openings followed a 4.2% July decline and openings were
off by 35.9% from last August. The series dates back to December
2000.
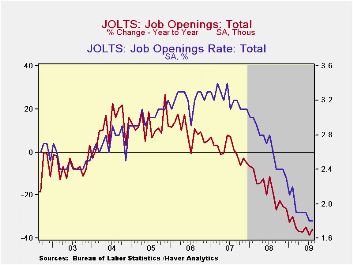
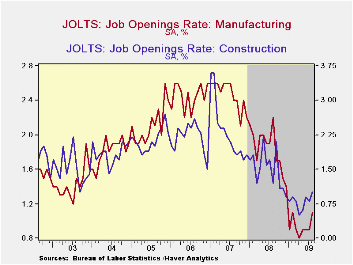
The actual number of job openings in the construction sector has been rising of late and is roughly double the series' low reached in February (-26.2% y/y) while factory sector job openings also have been rising modestly (-58.35 Y/Y). The level of professional & business services job openings reached a new series' low (-42.1% y/y as did education & health sectors jobs (-27.3% y/y). Openings in retail trade have risen slightly from their April low (-28.5% y/y) while government sector job openings reflected reduced tax revenues and fell to a new low (-27.1% y/y.
 The job
openings rate remained
stable at the July series' low of 1.8%. These rates were down from more
than a 3% rate in 2007. The job openings rate is the number
of job openings on the last business day of the month as a percent of
total employment plus job openings.
The job
openings rate remained
stable at the July series' low of 1.8%. These rates were down from more
than a 3% rate in 2007. The job openings rate is the number
of job openings on the last business day of the month as a percent of
total employment plus job openings.
The hires rate at 3.1% has improved slightly from its May-June lows but still was near the lowest in the series' short eight year history. The hires rate is the number of hires during the month divided by employment. The actual number of hires also was off its low but was still down by 13.4% year-to-year. Leisure & hospitality industry jobs were down by 16.5% but declines have stabilized since March. Factory sector (-12.6%) job declines also have stabilized as they may have in the retail sector (-18.4%). In the professional & business services dustry, the hires rate also has picked up recently -12.6% y/y while education & health services jobs are well up from their low (-2.3% y/y). The decline in hires in the construction sector also have may have stabilized but remain off 27.8% y/y.
 The job
separations rate reached
a new series' low of 3.3% with the actual number of separations off
12.7% year-to-year. Separations include quits, layoffs,
discharges, and other separations as well as retirements.
The job
separations rate reached
a new series' low of 3.3% with the actual number of separations off
12.7% year-to-year. Separations include quits, layoffs,
discharges, and other separations as well as retirements.
The JOLTS survey dates only to December 2000 but has followed the movement in nonfarm payrolls, though the actual correlation between the two series is low.
A description of the Jolts survey and the latest release from the U.S. Department of Labor is available here and the figures are available in Haver's USECON database.
Financial market utilities and the challenge of just-in-time liquidity from the Federal Reserve Bank of Chicago can be found here.
| JOLTS (Job Openings & Labor Turnover Survey) | August | July | August '08 | 2008 | 2007 | 2006 |
|---|---|---|---|---|---|---|
| Job Openings, Total | ||||||
| Rate (%) | 1.8 | 1.8 | 2.8 | 2.3 | 3.1 | 3.3 |
| Total (000s) | 2,387 | 2,408 | 3,722 | 3,224 | 4,382 | 4,606 |
| Hires, Total | ||||||
| Rate (%) | 3.3 | 3.3 | 3.7 | 41.1 | 46.1 | 47.6 |
| Total (000s) | 4,029 | 4,228 | 4,654 | 56,486 | 63,666 | 64,879 |
The U.S. Dollar and International Reserves
by Louise Curley October 12, 2009
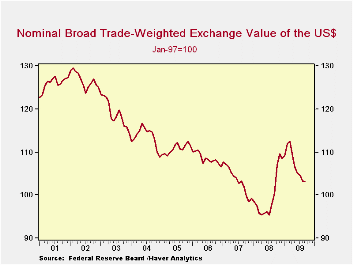 The 8% decline in the broad
trade-weighted dollar since
February of this year is having Central Bankers outside the United
States rethink the currency composition of their international reserve
holdings. A major reallocation of currencies could have serious
consequences for the U.S. Actually, this latest decline in the dollar
is from an unexpected high that resulted from the pursuits of safe
havens on the part of foreigners in the midst of the financial crisis.
As can be seen in the first chart, the long-term trend of the dollar on
a broad trade-weighted basis has been declining for the last seven or
eight years. During this time, there has been a steady shift in the
composition of total international reserves from dollars to Euros, as
can be seen in the second chart. Dollars now account for 62.8% of the
reserves of the countries reporting currency composition, compared with
72.7% in the second quarter of 2001. Meanwhile the share of euros has
gone from 17.6% to 27.5%.
The 8% decline in the broad
trade-weighted dollar since
February of this year is having Central Bankers outside the United
States rethink the currency composition of their international reserve
holdings. A major reallocation of currencies could have serious
consequences for the U.S. Actually, this latest decline in the dollar
is from an unexpected high that resulted from the pursuits of safe
havens on the part of foreigners in the midst of the financial crisis.
As can be seen in the first chart, the long-term trend of the dollar on
a broad trade-weighted basis has been declining for the last seven or
eight years. During this time, there has been a steady shift in the
composition of total international reserves from dollars to Euros, as
can be seen in the second chart. Dollars now account for 62.8% of the
reserves of the countries reporting currency composition, compared with
72.7% in the second quarter of 2001. Meanwhile the share of euros has
gone from 17.6% to 27.5%.
Data reported by the International Monetary Fund and found in
the Haver IFS Data Base can help in monitoring this
situation, particularly, Currency Composition of Official
Foreign Exchange Reserves, which is in dollars with a
quarterly frequency and Share of National
Currencies in Total Identified Official Holding of Foreign Economies, which
is in SDRs with an annual frequency. Reserves are also found in the
individual country source data.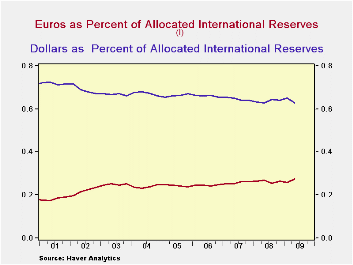
After declining in the third and fourth quarters of 2008 and the first quarter of 2009, total international reserves increased by $312 billion in the second quarter of this year to reach $6.80 trillion. Indications are that the rise has continued. Data for the third quarter of this year are not yet available for China, but data for some of the other large holders of reserves, namely, Japan, Russia, India, Taiwan and Korea are available and all have been increasing. Not all countries report the currency composition of their reserves. Unfortunately, among those not reporting is China, the holder of the largest reserves at $2.1 trillion. As a result, the amount of reserves for which the currency composition is known is much smaller--$4.3 trillion at the end of June 2009. It is this smaller universe that the data in the second chart are based.
| Q2 09 | Q1 09 | Q4 08 | Q3 08 | Q2 08 | |
|---|---|---|---|---|---|
| Total Foreign Exchange Reserves ( Billion $) | 6801.0 | 6489.4 | 6645.1 | 6846.6 | 6901.0 |
| Total Allocated | 4269.6 | 4057.9 | 4210.7 | 4360.6 | 438.2 |
| Emerging and Developing Countries Total | 4236.3 | 4076.3 | 4194.1 | 4440.6 | 4491.2 |
| Allocated | 2024.5 | 1946.7 | 2053.1 | 2238.1 | 2254.2 |

Tom Moeller
AuthorMore in Author Profile »Prior to joining Haver Analytics in 2000, Mr. Moeller worked as the Economist at Chancellor Capital Management from 1985 to 1999. There, he developed comprehensive economic forecasts and interpreted economic data for equity and fixed income portfolio managers. Also at Chancellor, Mr. Moeller worked as an equity analyst and was responsible for researching and rating companies in the economically sensitive automobile and housing industries for investment in Chancellor’s equity portfolio. Prior to joining Chancellor, Mr. Moeller was an Economist at Citibank from 1979 to 1984. He also analyzed pricing behavior in the metals industry for the Council on Wage and Price Stability in Washington, D.C. In 1999, Mr. Moeller received the award for most accurate forecast from the Forecasters' Club of New York. From 1990 to 1992 he was President of the New York Association for Business Economists. Mr. Moeller earned an M.B.A. in Finance from Fordham University, where he graduated in 1987. He holds a Bachelor of Arts in Economics from George Washington University.
More Economy in Brief
 Global| Feb 05 2026
Charts of the Week: Balanced Policy, Resilient Data and AI Narratives
by:Andrew Cates