 Global| Aug 26 2002
July New Home Sales a Record
by:Tom Moeller
|in:Economy in Brief
Summary
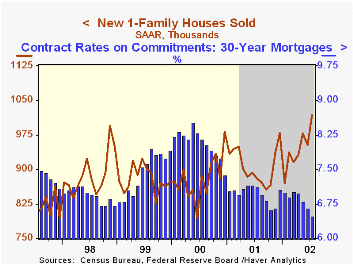
Sales of new single family homes last month were stronger than Consensus expectations for a 975,000 sales rate. June sales were revised lower. July sales were a record. Sales were mixed across the countrys regions: rising sharply in [...]

Sales of new single family homes last month were stronger than Consensus expectations for a 975,000 sales rate. June sales were revised lower. July sales were a record.
Sales were mixed across the country’s regions: rising sharply in the Midwest and South but falling in the Northeast and West.
The median price of a new home fell 8.4% to $170,700 (-2.6% y/y). Prices in June were revised up.
The new home sales data reflect current sales versus the existing home sales figure which reflect closings on past sales.
| Homes Sales (000s, AR) | July | June | Y/Y | 2001 | 2000 | 1999 |
|---|---|---|---|---|---|---|
| New Single-Family | 1,017 | 953 | 15.4% | 908 | 880 | 879 |
by Tom Moeller August 26, 2002

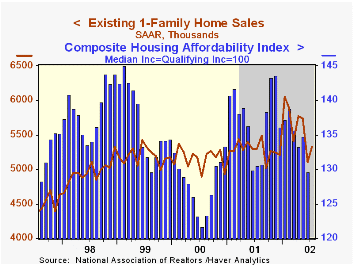
July sales of existing single family homes were about as expected, recouping much of the prior month's sharp decline which was lessened. Sales were 7.6% below the record pace set in March.
Sales through July were 5.4% above sales during the first seven months of 2001.
Home sales rose in each of the country’s four regions except the West.
The median price of an existing home fell 0.7% to $162,800 (7.3% y/y).
The figures reflect closings of past sales.
The average rate on a conventional 30-year mortgage fell to 6.49% last month versus 7.00% averaged during all of last year.
| Existing Home Sales (000, AR) | July | June | Y/Y | 2001 | 2000 | 1999 |
|---|---|---|---|---|---|---|
| Existing Single-Family | 5,330 | 5,100 | 0.6% | 5,291 | 5,159 | 5,193 |
by Tom Moeller August 26, 2002

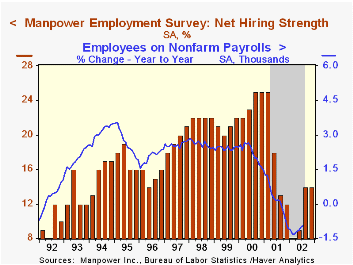
The Manpower Employment Outlook Survey index of net hiring was stable in 4Q02 at an improved 3Q02 level.
The not seasonally adjusted survey results indicated that 24% of firms plan to add employees in 4Q compared to 27% in 3Q. 9% planned to cut payrolls in 4Q compared to 8% in 3Q.
Over the last 25 years there has been an 81% correlation between the Manpower survey net hiring figure and the change in nonfarm payrolls. That correlation fell to 52% during the most recent ten years.
Manpower surveys nearly 16,000 public & private firms in 477 US markets.
| Manpower Employment Outlook Survey | 4Q02 | 3Q02 | 4Q01 | 2002 | 2001 | 2000 |
|---|---|---|---|---|---|---|
| All Industries: Net Higher (SA, %) | 14 | 14 | 12 | 11 | 17 | 24 |
Tom Moeller
AuthorMore in Author Profile »Prior to joining Haver Analytics in 2000, Mr. Moeller worked as the Economist at Chancellor Capital Management from 1985 to 1999. There, he developed comprehensive economic forecasts and interpreted economic data for equity and fixed income portfolio managers. Also at Chancellor, Mr. Moeller worked as an equity analyst and was responsible for researching and rating companies in the economically sensitive automobile and housing industries for investment in Chancellor’s equity portfolio. Prior to joining Chancellor, Mr. Moeller was an Economist at Citibank from 1979 to 1984. He also analyzed pricing behavior in the metals industry for the Council on Wage and Price Stability in Washington, D.C. In 1999, Mr. Moeller received the award for most accurate forecast from the Forecasters' Club of New York. From 1990 to 1992 he was President of the New York Association for Business Economists. Mr. Moeller earned an M.B.A. in Finance from Fordham University, where he graduated in 1987. He holds a Bachelor of Arts in Economics from George Washington University.


