 Global| Nov 25 2019
Just in Time, the Fed Found Easing Just in Time*
Summary
The behavior of the U.S. economy so far in 2019 reminds me of its behavior in 1967. The pace of U.S. economy activity slipped significantly in early 1967, but an “official” recession was narrowly avoided thanks to some timely easing [...]
The behavior of the U.S. economy so far in 2019 reminds me of its behavior in 1967. The pace of U.S. economy activity slipped significantly in early 1967, but an “official” recession was narrowly avoided thanks to some timely easing of monetary policy by the Fed. This period has since been referred to as the mini-recession of 1967. Similarly, thanks to some timely monetary-policy easing by the Fed this year, we may someday refer to this period as the mini-recession of 2019.
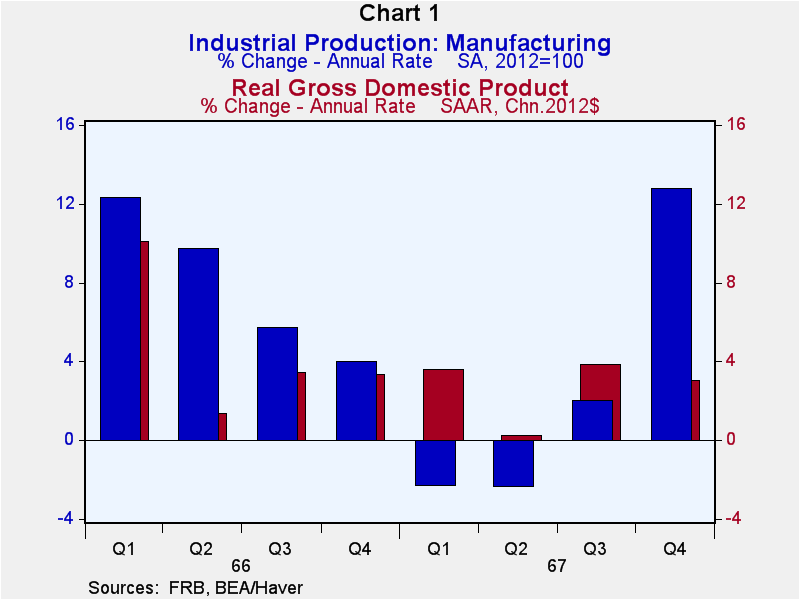
Let's review some pertinent data from the mini-recession of 1967. Plotted in Chart 1 are the quarter-to-quarter annualized percent changes in manufacturing industrial production (the blue bars) and real GDP (the red bars). Manufacturing industrial production contracted in the first and second quarters of 1967. Although real GDP growth slowed in the second quarter of 1967, it managed to eke out annualized growth of 0.25%. In the second half of 1967, growth returned to manufacturing industrial production and growth accelerated for real GDP.
Now, let's review Fed monetary policy during this period. The Fed starting aggressively pushing up the federal funds rate in September 1965 (the blue line in Chart 2). The federal funds rate went from about 4% in September 1965 to about 5-3/4% by November 1966. The spread between the Treasury 10-year security yield and the federal funds rate went from 0.28% (28 basis points) in September 1965 to minus 0.60% (minus 60 basis points) in November 1966 (the red bars in Chart 2). Then, the Fed started cutting the federal funds rate. By July 1967, the federal funds rate had fallen to about 3.8% and the 10-year Treasury security yield – federal funds rate spread had risen back into positive territory to a level of 137 basis points. The Fed's timely cuts in the federal funds rate, which promoted once again a positive spread between the 10-year Treasury security yield and the federal funds rate, prevented the onset of an official recession. A cut in time saves nine?
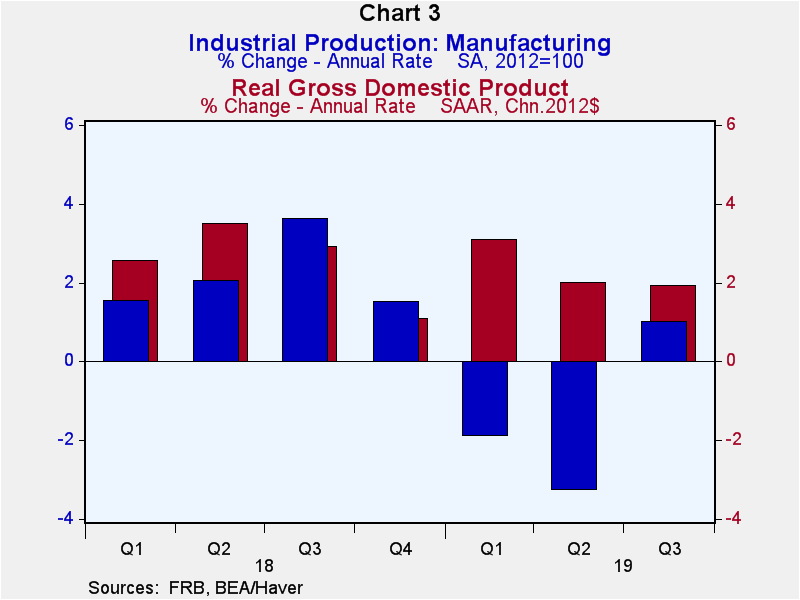
Let's move on to what is shaping up to be the mini-recession of 2019. Chart 3 shows that quarterly averages of manufacturing industrial production contracted in both the first and second quarters of 2019 (the blue bars). Yet, so far, quarter-to-quarter annualized percent changes in real GDP (the red bars) have managed to remain in positive territory. Admittedly, the fourth quarter of 2019 is going to be a close call inasmuch as The Atlanta Fed's GDPNow forecast for this quarter was only 0.4% as of November 18, 2019.
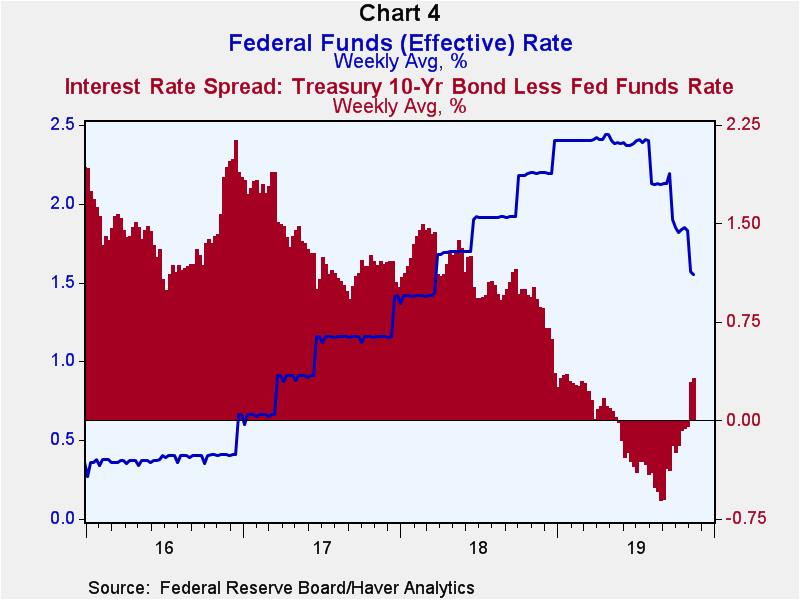
Chart 4 contains interest rate data pertaining to Fed monetary policy in recent years. The Fed initiated a series of the federal funds rate hikes at the end of 2016 (the blue line). In eight separate 25 basis point hikes, the Fed had raised the federal funds a cumulative 200 basis points to a level of 2.40% by the end of 2018. The spread between the Treasury 10-year security and the federal funds rate (the red bars) gradually narrowed as the Fed raised the federal funds rate. This interest-rate spread finally moved into negative territory in the week ended May 22, 2019. The spread reached its nadir of minus 62 basis points in the week ended August 28, 2019. At the end of July 2019, the Fed began its first of three 25 basis point cuts in the federal funds rate. By the week ended November 6, 2019, the interest-rate spread had moved back into positive territory.
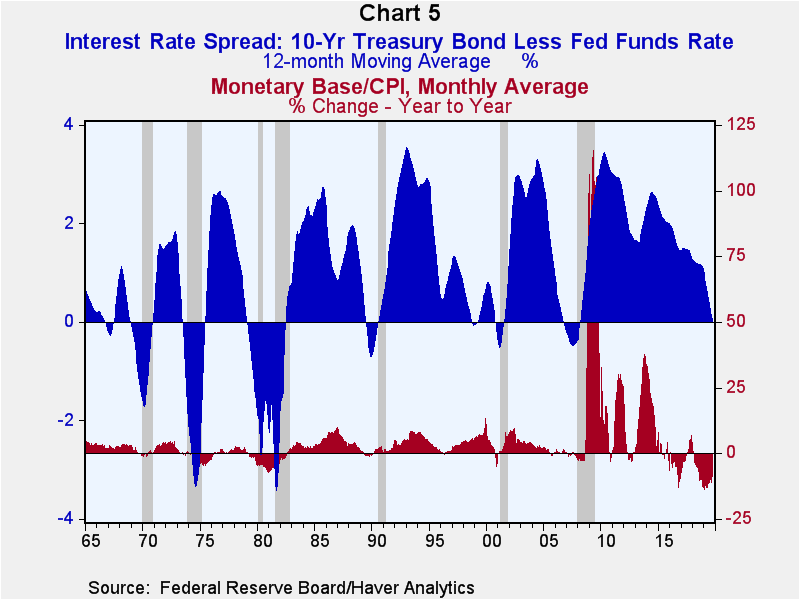
So, is the behavior of the U.S. macro economy in 2019 going to be remembered as the mini-recession of 2019 or is the economy about to enter an “official” recession? The Kasriel Recession Warning Indicator (the KRWI) would suggest that the U.S. economy is currently experiencing a mini-recession similar to what it experienced in 1967. On the off chance that you have forgotten, the KRWI, which is shown in Chart 5, is made up of the 12-month moving average of the interest-rate spread between the Treasury 10-year security and the federal funds rate (the blue mass) and the year-over-year percent change in the CPI-adjusted monetary base (the red mass). The shaded areas in Chart 5 signify periods of “official” recessions. Every U.S. recession starting with the 1970 recession has been preceded by both the 12-month moving average interest-rate spread being negative and the year-over-year percent change in the CPI-adjusted monetary base being negative. Preceding the 1967 mini-recession, the interest-rate spread component of the KRWI turned negative, but not the CPI-adjusted monetary base component. In March 2018, the year-over-year percent change in the CPI-adjusted monetary base moved into negative territory, where it still remains. But the 12-month moving average of the interest-rate spread remains in positive territory, just barely.
Chart 6 shows the interest-rate spread on a weekly basis (the blue bars) and on a 52-week moving average basis (the red line). As of the week ended November 13, 2019, the 52-week moving average of the interest-rate spread had not yet dipped into negative territory. And the last two weekly data points of the interest-rate spread were in positive territory. It is going to be a close call as to whether the 52-week moving average of the interest-rate spread stays in positive territory going forward. Going forward, there will be more negative data points for the interest-rate spread entering the calculation of the 52-week moving average. Whether the magnitudes of the current and likely near-term future positive data points are large enough to offset the past negative data points remains to be seen.
In sum, the Fed may have found easing just in time to prevent the U.S. economy from entering an “official” recession in 2019 or early 2020. To date, that's what the KRWI would suggest. Although the Fed has indicated that it now does not plan on dropping the federal funds rate in the foreseeable future, that plan can be changed if near-term weaker readings on the U.S. economy are forthcoming. I expect that weaker readings will be forthcoming. So, I would not rule out one or two “insurance” 25 basis point cuts in the federal funds rate in early 2020. Regardless, the Fed appears to have lucked out by finding easing just in time. Sometimes it is better to be lucky than smart.
*With apologies to Jule Styne, Judy Holliday and Sidney Chaplin.
Viewpoint commentaries are the opinions of the author and do not reflect the views of Haver Analytics.Paul L. Kasriel
AuthorMore in Author Profile »Mr. Kasriel is founder of Econtrarian, LLC, an economic-analysis consulting firm. Paul’s economic commentaries can be read on his blog, The Econtrarian. After 25 years of employment at The Northern Trust Company of Chicago, Paul retired from the chief economist position at the end of April 2012. Prior to joining The Northern Trust Company in August 1986, Paul was on the official staff of the Federal Reserve Bank of Chicago in the economic research department. Paul is a recipient of the annual Lawrence R. Klein award for the most accurate economic forecast over a four-year period among the approximately 50 participants in the Blue Chip Economic Indicators forecast survey. In January 2009, both The Wall Street Journal and Forbes cited Paul as one of the few economists who identified early on the formation of the housing bubble and the economic and financial market havoc that would ensue after the bubble inevitably burst. Under Paul’s leadership, The Northern Trust’s economic website was ranked in the top ten “most interesting” by The Wall Street Journal. Paul is the co-author of a book entitled Seven Indicators That Move Markets (McGraw-Hill, 2002). Paul resides on the beautiful peninsula of Door County, Wisconsin where he sails his salty 1967 Pearson Commander 26, sings in a community choir and struggles to learn how to play the bass guitar (actually the bass ukulele). Paul can be contacted by email at econtrarian@gmail.com or by telephone at 1-920-559-0375.


