 Global| Nov 21 2005
Leading Economic Indicators Recovered
by:Tom Moeller
|in:Economy in Brief
Summary
The Conference Board reported that the Composite Index of Leading Economic Indicators recovered 0.9% in October. The rise recouped virtually all of the index's declines since June. The breadth of one month gain amongst the 10 [...]
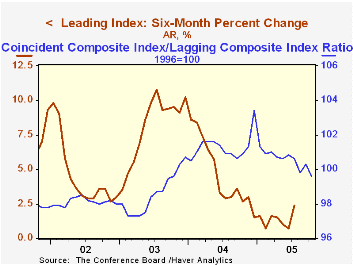
The Conference Board reported that the Composite Index of Leading Economic Indicators recovered 0.9% in October. The rise recouped virtually all of the index's declines since June.
The breadth of one month gain amongst the 10 components of the leading index improved to 70% and was the broadest since June. Lower claims for unemployment insurance and longer hours worked in the factory sector had the largest positive effects on the leaders' one month change and offset large negative influences from lower stock prices and lower building permits.
The method of calculating the contribution to the index from the interest rate yield spread has been revised. A negative contribution will now occur only when the spread inverts rather than when declining as in the past. More details can be found here.
The leading index is based on eight previously reported economic data series. Two series, orders for consumer goods and orders for capital goods, are estimated.
The coincident indicators rose 0.1% following an upwardly revised 0.3% rise during September. During the last ten years there has been a 64% correlation between the change in the coincident indicators and real GDP.
The lagging indicators rose 0.8%. Higher C&I loans and a higher services CPI growth rate contributed greatly to the October increase. The ratio of coincident to lagging indicators, a measure of actual economic performance versus excess, fell after an upwardly revised September gain to its lowest level since late 2003.
Visit the Conference Board's site for coverage of leading indicator series from around the world.
| Business Cycle Indicators | Oct | Sept | 6 Month Chg., AR | 2004 | 2003 | 2002 |
|---|---|---|---|---|---|---|
| Leading | 0.9% | -0.8% | 2.4% | 7.7% | 5.1% | 5.0% |
| Coincident | 0.1% | 0.3% | 1.2% | 2.7% | 0.4% | -0.6% |
| Lagging | 0.8% | -0.2% | 3.4% | -0.1% | -0.1% | -0.7% |
by Louise Curley November 21, 2005
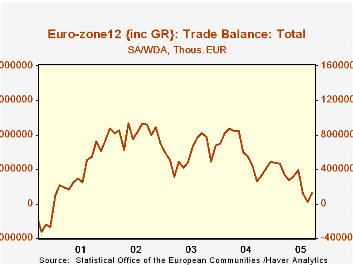
The Euro Zone's surplus on trade in goods rose in September to 1,239.5 million euros from 190.0 million euros in August. This was only the third month this year in which a rise in the trade balance took place. For the nine months through September, the trade surplus is 57% below the corresponding period of 2004. The deterioration in the trade surplus is shown in the first chart.
The main factors in the deterioration of the trade surplus have been the rise in the euro which tended to dampen export demand and the rise in the price of oil which increased imports. The second chart shows the year-to-year increases in total imports and imports of mineral fuels and lubricants. Since early 2004 the year-to-year increase in imports of mineral fuels and lubricants has ranged between 25 and 50%. 
The euro has been declining for most of this year and the price of crude has recently eased suggesting that the outlook for the balance of trade in goods is improving. The Euro has declined about 14% from the peak reached on December 30, 2004.Just two months ago the Brent Crude oil was $64.49 a barrel. It is now 18% lower at $52.66. The dollar value of the euro and the price of Brent Crude oil are shown in the third chart on a daily basis.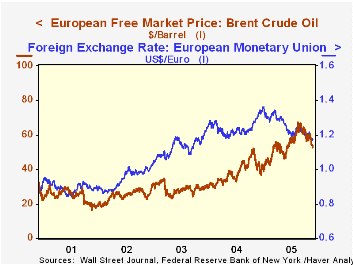
| Euro Zone Trade in Goods (Millions of Euros) | Sep 05 | Aug 05 | Sep 04 | M/M % | Y/Y % | 2004 | 2003 | 2002 |
|---|---|---|---|---|---|---|---|---|
| Trade Balance | 1,239 | 190 | 2,673 | 1,049* | -1,434* | 71,827 | 70,027 | 99,097 |
| Exports | 107,019 | 106,672 | 95,492 | 0.33 | 12.07 | 1,144,937 | 1,059,880 | 1,083,611 |
| Imports | 105,779 | 106,482 | 92,818 | -0.66 | 13.96 | 1,073,110 | 989,853 | 984,514 |
| Mineral Fuels & Lubricants | 22,285 | 23,126 | 15,545 | -3.66 | 43.36 | 164,390 | 143,620 | 137,521 |
| Peak | Date | Current | Date | Pct Chg | ||||
| Euro ($) | 1.3623 | 12/30/04 | 1.1741 | 11/18/05 | -13.8 | |||
| Brent Crude Oil ($/bbl) | 64.49 | 9/21/05 | 52.66 | 11/18/05 | -18.3 | |||
| *Difference | ||||||||

Tom Moeller
AuthorMore in Author Profile »Prior to joining Haver Analytics in 2000, Mr. Moeller worked as the Economist at Chancellor Capital Management from 1985 to 1999. There, he developed comprehensive economic forecasts and interpreted economic data for equity and fixed income portfolio managers. Also at Chancellor, Mr. Moeller worked as an equity analyst and was responsible for researching and rating companies in the economically sensitive automobile and housing industries for investment in Chancellor’s equity portfolio. Prior to joining Chancellor, Mr. Moeller was an Economist at Citibank from 1979 to 1984. He also analyzed pricing behavior in the metals industry for the Council on Wage and Price Stability in Washington, D.C. In 1999, Mr. Moeller received the award for most accurate forecast from the Forecasters' Club of New York. From 1990 to 1992 he was President of the New York Association for Business Economists. Mr. Moeller earned an M.B.A. in Finance from Fordham University, where he graduated in 1987. He holds a Bachelor of Arts in Economics from George Washington University.
More Economy in Brief

 Global| Feb 05 2026
Charts of the Week: Balanced Policy, Resilient Data and AI Narratives
by:Andrew Cates

