 Global| Feb 24 2003
Manpower Survey Hiring Index Fell for 2Q03
by:Tom Moeller
|in:Economy in Brief
Summary
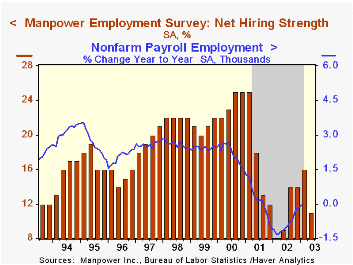
The Manpower Employment Outlook Survey index of net hiring deteriorated for 2Q03 from the improved level of the prior nine months. The not seasonally adjusted survey results indicated that 22% of firms plan to add employees in 2Q03 [...]

The Manpower Employment Outlook Survey index of net hiring deteriorated for 2Q03 from the improved level of the prior nine months.
The not seasonally adjusted survey results indicated that 22% of firms plan to add employees in 2Q03 compared to 20% in 1Q. 9% planned to cut payrolls in 1Q compared to 12% in 1Q.
Deterioration in the net hiring index occurred after seasonal adjustment.
Over the last 25 years there has been an 76% correlation between the Manpower survey net hiring figure and the y/y change in nonfarm payrolls. That correlation fell to 52% during the most recent ten years.
Manpower surveys nearly 16,000 public & private firms in 477 US markets.
For the latest press release covering hiring intentions from Manpower Inc., click here.
| Manpower Employment Outlook Survey | 2Q03 | 1Q03 | 2Q02 | 2002 | 2001 | 2000 |
|---|---|---|---|---|---|---|
| All Industries: Net Higher (SA, %) | 11 | 16 | 9 | 11 | 17 | 24 |
by Tom Moeller February 24, 2003

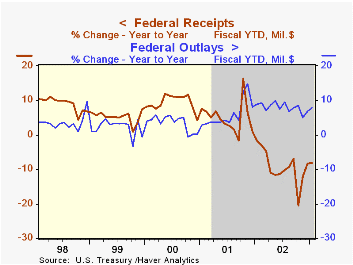
The US budget last month came in near Consensus expectations for a $10.0 bil. surplus. That surplus was a fraction of the prior year's figure. For the first four months of FY03, the federal government ran a deficit of $97.6 bil. versus a $0.8 bil. surplus during the first four months of FY02.
Net receipts for the first four months of FY03 fell 8.1% versus last year. Individual tax payments fell 9.4%. Corporate income taxes were down 47.4%. Social insurance contributions were up 3.9%.
Federal expenditures rose 7.8% versus last fiscal year's first four months. Defense spending was up 18.6%. Spending on health (9.5%) and education (16.7%) programs continued strong. Spending on income security was up 14.3% as the unemployment rate rose. Interest expense was down 7.4% y/y.
| US Government Finance | Jan | Dec | Jan '02 | FY2002 | FY2001 | FY2000 |
|---|---|---|---|---|---|---|
| Budget Balance | $11.1B | $4.4B | $43.7B | $-157.8B | $127.3B | $236.4B |
| Revenues | $187.9B | $182.8B | -7.6% | -6.9% | -1.7% | 10.8% |
| Outlays | $176.8B | $178.4B | 10.7% | 7.9% | 4.2% | 5.1% |
Tom Moeller
AuthorMore in Author Profile »Prior to joining Haver Analytics in 2000, Mr. Moeller worked as the Economist at Chancellor Capital Management from 1985 to 1999. There, he developed comprehensive economic forecasts and interpreted economic data for equity and fixed income portfolio managers. Also at Chancellor, Mr. Moeller worked as an equity analyst and was responsible for researching and rating companies in the economically sensitive automobile and housing industries for investment in Chancellor’s equity portfolio. Prior to joining Chancellor, Mr. Moeller was an Economist at Citibank from 1979 to 1984. He also analyzed pricing behavior in the metals industry for the Council on Wage and Price Stability in Washington, D.C. In 1999, Mr. Moeller received the award for most accurate forecast from the Forecasters' Club of New York. From 1990 to 1992 he was President of the New York Association for Business Economists. Mr. Moeller earned an M.B.A. in Finance from Fordham University, where he graduated in 1987. He holds a Bachelor of Arts in Economics from George Washington University.


