 Global| Nov 09 2010
Manufacturing In The Netherlands
Summary
Manufacturing in the Netherlands accounts for about 15% of total Real Gross Value Added, but 57% of the Gross Value Added by the goods producing sectors. Data on new orders, turnover and production in manufacturing are available in [...]
 Manufacturing in the Netherlands accounts for about 15% of total Real Gross Value Added, but 57% of the Gross Value
Added by the goods producing sectors. Data on new orders, turnover and production in manufacturing are available in
the Haver Analytics' data base, NETHERLANDS. Data for September were released today.
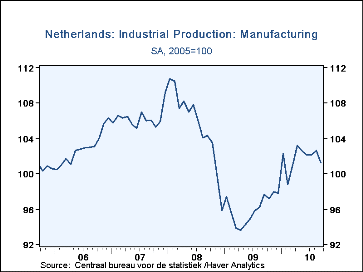
The index of Industrial production in Manufacturing has fallen or increased minimally in each month since April of this year when it reached 103.2 (2005=100), its highest point since the recession low of 93.6 in April, 2009. The index of industrial production in manufacturing declined 1.4% in September and, at 101.2, is 8.6% below the pre-recession peak of 110.7 in January, 2008 as can be seen in the first chart.
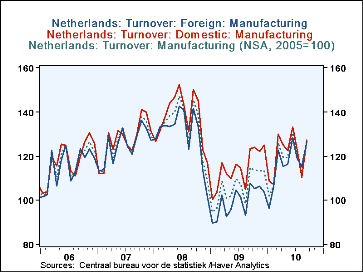
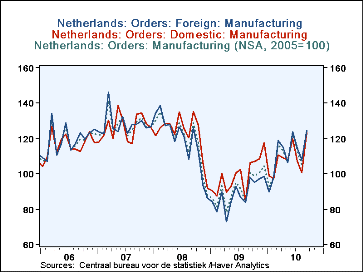
Both the indexes of orders and turnover (sales) were up sharply in September. The index of orders was up 17.9% and that of turnover, up 11.9%. The indexes of orders and turnover are not seasonally adjusted, but as can be seen in the second and third charts, although the data are erratic, the trend in recent months is positive in both cases. Increasing orders and sales suggest that the outlook for production in the months ahead should be positive.
| Netherlands: Manufacturing(2005=100) | ||||||||
|---|---|---|---|---|---|---|---|---|
| Sept 10 | Aug 10 | Sept 09 | M/M % | Y/Y % | 2009 | 2008 | 2007 | |
| Production | 101.2 | 102.6 | 97.7 | -1.4 | 3.6 | 96.0 | 105.4 | 106.3 |
| Orders | ||||||||
| Total | 124.1 | 105.3 | 10.4 | 17.9 | 23.6 | 91.8 | 19.4 | 127.5 |
| Domestic | 123.3 | 100.3 | 106.0 | 22.9 | 16.3 | 98.9 | 12.5 | 126.4 |
| Foreign | 124.4 | 107.6 | 97.8 | 15.2 | 27.2 | 88.5 | 118.4 | 128.0 |
| Turnover | ||||||||
| Total | 126.7 | 113.2 | 114.6 | 11.9 | 10.6 | 106.1 | 133.2 | 126.1 |
| Domestic | 127.2 | 110.6 | 123.3 | 15.0 | 3.2 | 114.5 | 137.3 | 127.3 |
| Foreign | 126.3 | 115.3 | 107.7 | 9.5 | 17.3 | 99.5 | 130.0 | 125.1 |
More Economy in Brief
 Global| Feb 05 2026
Charts of the Week: Balanced Policy, Resilient Data and AI Narratives
by:Andrew Cates


