 Global| May 01 2012
Manufacturing PMIs in US, Canada UK and Ireland
Summary
Estimates of manufacturing activity in April by purchasing managers in the United States, Canada, Ireland and the United Kingdom were released today. The majority of those in the United States and Canada were increasingly optimistic. [...]
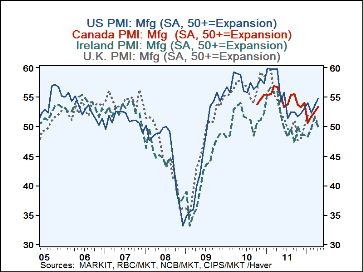
Estimates of manufacturing activity in April by purchasing managers in the United States, Canada, Ireland and the United Kingdom were released today. The majority of those in the United States and Canada were increasingly optimistic. In the U.S., the diffusion index rose from 53.4% in March to 54.8% and, in Canada, from 52.4% to 53.3% in April both in the in the expansion phase of the cycle. (The Canadian PMI is relatively new having been introduced as recently as October, 2010.) The majority of purchasing managers in the U.K. and Ireland were also optimistic, but the majority in the U. K., slipped from 51.9% in March to 50.5% in April and, in Ireland, from 51.9% in March to 50.1% in April, both now barely in the expansion phase.
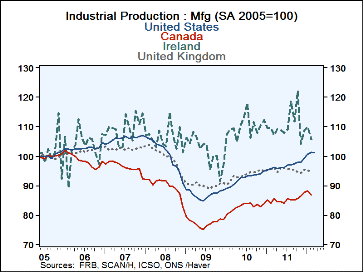
The PMIs are a good indicator of future trends in manufacturing production. The first chart shows the PMIs for manufacturing and the second manufacturing industrial production. The weakness in the PMIs from early 2011 in the first chart was greater in the United Kingdom and in Ireland than that shown in the Canadian and United States PMIs. Manufacturing production in these countries, as shown in the second chart, has recently tended to decline while that in the U. S. and Canada has tended to rise. Recent values of the PMIs for the four countries suggest that this pattern is likely to persist.
| PMI | Apr'12 | Mar'12 |
|---|---|---|
| United States | 54.8 | 53.4 |
| Canada | 53.3 | 52.4 |
| United Kingdom | 50.5 | 51.9 |
| Ireland | 50.1 | 51.5 |


