 Global| May 09 2005
March Industrial Production Data Show Declines in Developed and Emerging Nations
Summary
March Industrial production data were released today for the developed nations-- Germany, Denmark, the United Kingdom; and for the developing nations--Slovakia, Turkey and Malaysia. Each country reported a decline in production from [...]

March Industrial production data were released today for the developed nations-- Germany, Denmark, the United Kingdom; and for the developing nations--Slovakia, Turkey and Malaysia. Each country reported a decline in production from February, adding to the evidence of a slow down in world growth in the first quarter of 2005.
While Turkey showed the largest decline, it followed an unusually large-- 9%-- rise in February. Unexpected declines occurred in the United Kingdom where production was down by 1.14% and in Germany where production declined by 0.79%. In both cases the consensus had predicted a rise.
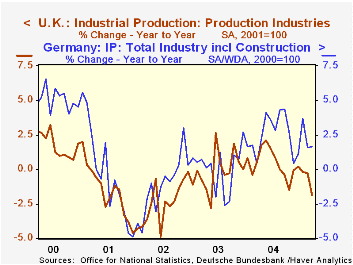
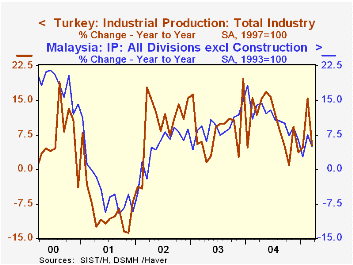
The year-to-year percentage changes in the data generally show a declining trend over the past year or so in all the reporting countries except Germany, where the data appear trend less. The first chart compares the year-to-year changes in production for Germany and the United Kingdom. Although Turkey and Malaysia show a declining trend in year-to-year changes, the percent changes have yet to record declines, indicating that production is still increasing on a year-to-year basis as shown in the second chart.  The same cannot be said for Denmark where the average year-to-year decline for the first quarter was 3.88% and for Slovakia where there has been little change in the level of production.
| INDUSTRIAL PRODUCTION | Mar 05 | Feb 05 | Mar 04 | M/M% | Y/Y% | 2004 | 2003 | 2002 |
|---|---|---|---|---|---|---|---|---|
| Germany (2000=1000 | 100.9 | 101.7 | 99.3 | -0.79 | 1.61 | 100.8 | 98.4 | 98.3 |
| U. K. (2001=100) | 95.8 | 96.9 | 97.6 | -1.14 | -4.84 | 97.8 | 97.3 | 97.5 |
| Denmark (2000=100) | 97 | 99 | 103 | -2.02 | -5.83 | 102 | 102 | 103 |
| Turkey (1997=100) | 129.0 | 137.0 | 122.7 | -5.84 | 5.13 | 123.4 | 112.4 | 103.4 |
| Slovakia (2000=100) | 124.1 | 126.7 | 127.9 | -2.05 | -2.97 | 124.7 | 120.9 | 114.8 |
| Malaysia (1993=100) | 237.5 | 240.3 | 226.0 | -1.17 | 5.09 | 229.6 | 206.3 | 188.8 |


