 Global| Dec 10 2010
Marked Decrease in U.S. Trade Deficit in October
Summary
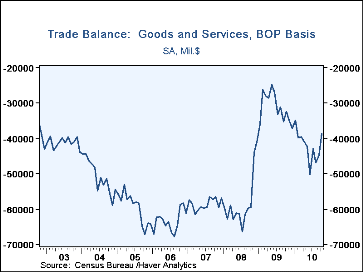
The U.S. foreign trade deficit narrowed markedly to $38.7B in October from $44.6B in September (revised from $44.0B). Consensus forecasts had looked for a result unchanged from September. Both exports and imports contributed to the [...]
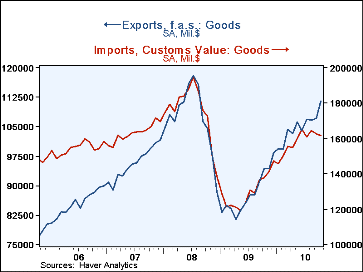
The U.S. foreign trade deficit narrowed markedly to $38.7B in October from $44.6B in September (revised from $44.0B). Consensus forecasts had looked for a result unchanged from September. Both exports and imports contributed to the narrowing; exports surged 3.2% to $158.7B (up 14.9% year/year), while imports edged lower by 0.5% to $197.4B (+15.9% y/y). In chained 2005 dollars, the deficit in goods decreased to $45.2B from $50.3B the month before; exports on that basis were up 11.3% year/year and imports, 13.0%.
Nominal exports of goods rose in every major end-use category in October. The largest in dollar terms was industrial materials and supplies, up $2.6B, the largest monthly dollar gain ever in this category (data began in 1986); this amounted 8.1% (26.2% y/y). Foods, feeds and beverages exports had the second-largest increase, $735M, also an 8.0% change from the prior month (26.1% y/y). Capital goods increased 1.0% m/m, equivalent to 13.6% y/y. Automotive sector exports were up 4.6% m/m and 22.4% y/y. Consumer goods other than automotive and food rose 0.9% in the month and 2.4% on the year. "Other" goods were up 2.6% in the month and 30.2% on the year.
Imports were a mixed bag in October. The decline in goods was $1.2B, 0.8% m/m (still up 17.5% y/y, though). Food, industrial materials and capital goods were all down month-on-month, automotive was virtually flat and consumer and other goods increased. Imports of petroleum were off 6.7% in the month (up 12.2% from a year ago), while non-petroleum imports edged up 0.4% (but +18.5% year/year).
Among services, exports rose 0.9% (8.3% y/y). Travel, passenger fares, other transportation, royalties & fees and other private services all increased modestly. U.S. government military sales contracts were the only services category to show a monthly decline. Imports of services rose in October by 0.6% (8.0% y/y) with travel, passenger fares, royalties and "other" private services increasing, while other transportation, i.e., freight, and the U.S. government's services imports fell from September.
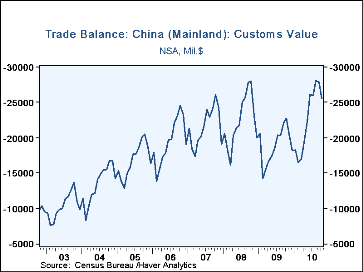
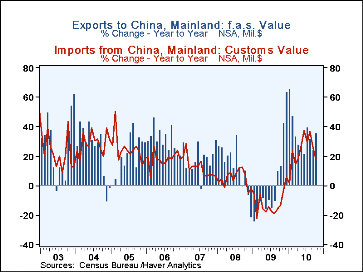
The goods deficit with China was $25.5B in October, down from $27.8B in September, but mildly wider than $22.7B in October 2009. Exports jumped to $9.3B from $7.2B in September and $6.9B a year ago. Imports, obviously much larger, actually eased slightly for a second consecutive month, down 0.5% to $34.8B from $35.0B; a year ago they were $29.6B. As we examine these data we see that U.S. exports to China are firming up generally. The absolute dollar numbers remain modest, but the percentage changes are substantial; October's year/year gain was 35.2%, capping a 12-month period when the smallest monthly gain from the comparable month the year before was 21.0% (June) and the largest was 65.9% (January). [In the graph of the deficit with China, we have inverted the scale, so the decline in the October deficit appears as a downward movement in the series; scale inversion is a standard option in DLXVG3, Haver's proprietary graphics software.]
The international trade data can be found in Haver's USECON database. Detailed figures are available in the USINT database.
A balanced economic recovery across the globe was the subject of a recent presentation by Fed Chairman Bernanke at an ECB conference in Frankfurt. The text of his presentation, along with his charts, can be found here.
| Foreign Trade | Oct | Sept | Aug | Y/Y | 2009 | 2008 | 2007 |
|---|---|---|---|---|---|---|---|
| U.S. Trade Deficit | $38.7B | $44.6B | $46.5B | $32.3B(10/09) | $374.9B | $698.8B | $702.1B |
| Exports-Goods & Services (m/m) | 3.2% | 0.5% | -0.1% | 14.9% | -14.6% | 11.5% | 13.5% |
| Imports-Goods & Services | -0.5 | -1.7 | 2.0 | 15.9 | -23.3 | 8.0 | 6.3 |
| Petroleum | -6.7 | -0.4 | 3.5 | 12.2 | -44.0 | 37.0 | 9.4 |
| Nonpetroleum | +0.4 | -1.2 | 2.1 | 18.5 | -20.9 | 1.5 | 4.8 |
Carol Stone, CBE
AuthorMore in Author Profile »Carol Stone, CBE came to Haver Analytics in 2003 following more than 35 years as a financial market economist at major Wall Street financial institutions, most especially Merrill Lynch and Nomura Securities. She had broad experience in analysis and forecasting of flow-of-funds accounts, the federal budget and Federal Reserve operations. At Nomura Securities, among other duties, she developed various indicator forecasting tools and edited a daily global publication produced in London and New York for readers in Tokyo. At Haver Analytics, Carol was a member of the Research Department, aiding database managers with research and documentation efforts, as well as posting commentary on select economic reports. In addition, she conducted Ways-of-the-World, a blog on economic issues for an Episcopal-Church-affiliated website, The Geranium Farm. During her career, Carol served as an officer of the Money Marketeers and the Downtown Economists Club. She had a PhD from NYU's Stern School of Business. She lived in Brooklyn, New York, and had a weekend home on Long Island.
More Economy in Brief
 Global| Feb 05 2026
Charts of the Week: Balanced Policy, Resilient Data and AI Narratives
by:Andrew Cates


