 Global| Mar 15 2010
Measures Of Inflation For India And China
Summary
Rapid recovery from the recession in the emerging countries of the Pacific Rim is putting pressure on consumer and wholesale prices, notably in India and China. Data on inflation for the two countries can be found in Haver Analytics' [...]
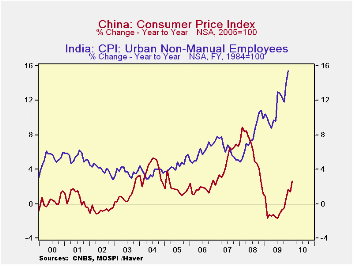
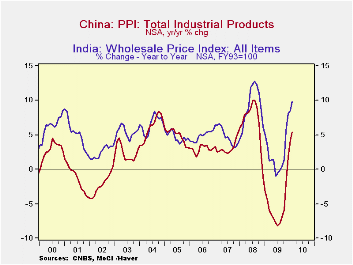
Rapid recovery from the recession in the emerging countries of the Pacific Rim is putting pressure on consumer and wholesale prices, notably in India and China. Data on inflation for the two countries can be found in Haver Analytics' EMERGEPR data base. In February, the year to year increase in China's CPI--the measure of inflation-- was 2.66%. There has been an almost steady rise form the last July when prices were 1.68% below the year ago figure. Inflation is much higher in India. The most up to date inflation data for India are the January, 2010 inflation rates for Industrial, Agricultural and Rural Workers, which were 16.22%, 17.57% and 17.35% respectively. The latest date for the General Index, an overall index, is December, 2009 when the inflation rate was 15.47%. Consumer prices in the two countries are shown in the first chart.


| Feb 10 | Jan 10 | Dec 09 | Nov 08 | Oct 09 | Sep 09 | Aug 09 | Jul 09 | |
|---|---|---|---|---|---|---|---|---|
| China | ||||||||
| Y/Y % CHANGE IN CPI | 2.66 | 1.42 | 1.70 | 0.50 | -0.53 | -0.71 | -1.06 | -1.68 |
| Y/Y% CHANGE IN PPI | 5.40 | 4.30 | 1.70 | -2.08 | -5.80 | -6.95 | -7.95 | -8.20 |
| India | ||||||||
| Y/Y % CHANGE IN CPI General Index | N/A | N/A | 15.47 | 13.91 | 11.83 | 12.39 | 12.88 | 13.04 |
| Y/Y % CHANGE IN CPI Industrial Workers | N/A | 16.22 | 14.97 | 13.51 | 11.49 | 11.64 | 11.72 | 11.89 |
| Y/Y % CHANGE IN CPI Agric Workers | N/A | 17.57 | 17.21 | 15.65 | 13.73 | 13.18 | 12.89 | 12.90 |
| Y/Y % CHANGE IN CPI Rural Workers | N/A | 17.35 | 16.99 | 15.65 | 13.51 | 12.97 | 12.67 | 12.67 |
| Y/Y% CHANGE IN WPI | 9.89 | 8.56 | 8.10 | 5.55 | 1.41 | -0.46 | -0.17 | -0.54 |
More Economy in Brief
 Global| Feb 05 2026
Charts of the Week: Balanced Policy, Resilient Data and AI Narratives
by:Andrew Cates


