 Global| Nov 26 2007
Mexico and Chile: Balances of Payments
Summary
Mexico and Chile released third quarter data on their balances of payments today. Mexico's account balance continues to run between a little below and a little above -1% of GDP while that of Chile has been positive for the past three [...]
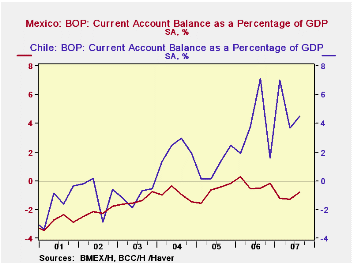
Mexico and Chile released third quarter data on their balances
of payments today. Mexico's account balance continues to run between a
little below and a little above -1% of GDP while that of Chile has been
positive for the past three years and has ranged between 4-7% of GDP so
far this year. The trends in the Current account as percentage of GDP
are shown in the first chart.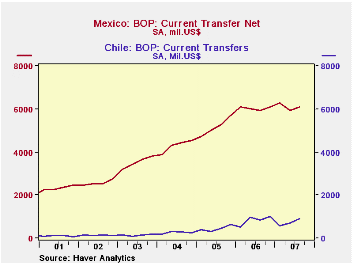
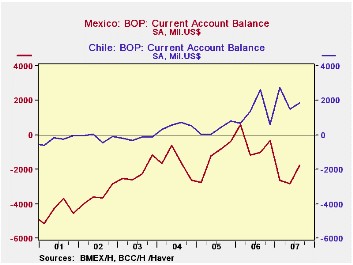
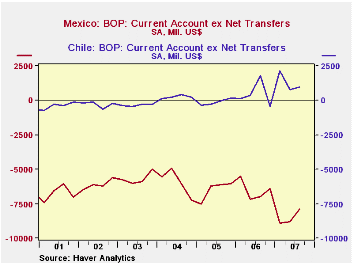
In dollar terms, Mexico's current account was -$1768 million US in the third quarter of this year, an improvement over the deficits of $2844 and $2624 million in the second and first quarters of the year. In Chile, the current account was $1869 in the third quarter. The trend in the current account of each country is shown in the second chart. In both cases, but to a far greater degree in Mexico than in Chile, remittances from their nationals working abroad have been significant factors in reducing the current account balances. The third charts shows the relative magnitudes of net transfers in the two countries and the fourth chart shows the current account of each country excluding net transfers.
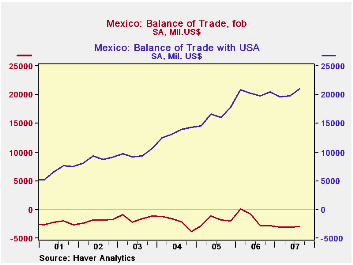
Another striking feature of Mexico's current account is the dominance of US trade. In the third quarter the total balance of trade in goods was-$2,926 million, but the balance of trade in goods with the US was a positive $20994 million as shown in the fifth chart.
| Balances of Payments (Mil. US$) | Q3 07 | Q2 07 | Q1 07 | 2006 | 2005 | 2004 |
|---|---|---|---|---|---|---|
| CHILE | ||||||
| Current Account (% of GDP) | 4.52 | 3.67 | 7.05 | 3.59 | 1.02 | 2.16 |
| Current Account (Mil. US$) | 1869 | 1497 | 2759 | 5256 | 1315 | 2074 |
| Net Transfer (Mil. US$) | 905 | 589 | 589 | 3357 | 1791 | 1072 |
| Current Account ex Net Transfers | 964 | 782 | 2170 | 1899 | -476 | 1003 |
| MEXICO | ||||||
| Current Account (% of GDP) | -0.78 | -1.30 | -1.22 | -0.22 | -0.70 | -0.95 |
| Current Account (Mil. US$) | -1768 | -2844 | -2624 | -1928 | -5179 | -6576 |
| Net Transfer (Mil. US$) | 6091 | 5934 | 6268 | 24127 | 20736 | 17162 |
| Current Account ex Net Transfers | -8859 | -8778 | -8892 | -26055 | -25915 | -23738 |
| Balance on Trade in Goods | -2926 | -3083 | -3049 | -6242 | -7655 | -8755 |
| Balance on Trade in Goods with USA | 20994 | 19776 | 19624 | 81466 | 65019 | 53698 |
More Economy in Brief
 Global| Feb 05 2026
Charts of the Week: Balanced Policy, Resilient Data and AI Narratives
by:Andrew Cates


