Global| Apr 05 2010
Money Supply Growth Begins To Shift – Is That All?
Summary
So far only the UK is showing a sharp shift in its rate of money growth. But the e-Zone is showing a small money growth revival. US money growth has been dropping very rapidly but is showing a hint of stability- still its sequential [...]
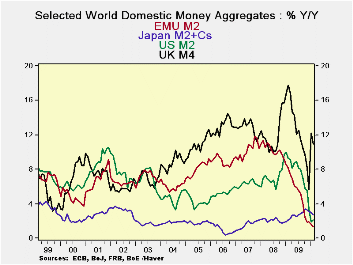
So far only the UK is showing a sharp shift in its rate of money growth. But the e-Zone is showing a small money growth revival. US money growth has been dropping very rapidly but is showing a hint of stability- still its sequential rates of growth continue to ramp down. Japan’s money growth that has so very steady has taken a step lower. But Japan’s Tankan report suggests that the economy there is getting better and that the downturn in money growth may not be signaling a new round of weakness. In truth central banks have not taken their cues from money growth for some time. Is that about to change?
EMU, the US and the UK have seen the biggest winding down in money growth rates from their cycle peaks. The UK has seen that wind-down give way to a bounce. The US shows a hint of some stabilization in money growth but real balances are contacting over the most recent three-months. EMU shows only a slowing in the pace of money supply deceleration in its Yr/Yr trends but real balances over three-months have posted positive growth. . In the Zone Credit to residents and loans continue to contract in real terms but they are slowing their pace of contraction, too.
Money growth rates seem to be showing signs - or at least hints -of stabilization. In the US the jobs figures for March hint that the period of job contraction may have some to a close. In Japan the tankan report was better than expected. EMU and the UK continue to blow and hot and cold reports back and forth. Europe still seems to be having a tough time posting consistent growth numbers. EMU, in particular is dealing with PR issues and the reality of very divergent circumstances across member countries, challenging the ECB. The UK continues to get battered with some seasonably extreme weather but also to continue to issue a very uneven stream of economic reports.
In the wake of the US jobs report the entire global picture is looking better. Commodity prices tell a story of new confidence in growth prospects. Money supply trends do not wave any cautionary flags about building inflation, however. The UK has persistently high money growth and is also experiencing an inflation overshoot. The Bank of England has said it will let it run its course since it views the overshoot as being not problematical. In the US, with job growth coming on stream, ‘inflationists’ are sounding warning signals. In Europe recent German inflation reports have been boosted by rising oil prices, this will make the ECB wary regardless of other zone issues. Bond yields are moving up.
It is true that there is a shifting of trends and of risks but it is really even more subtle than what it seems. There remains a great deal of slack in the global economy. In the US alone the recession displaced eight and one-half million people (net!). Putting 162,000 back to work in one month can’t ramp up much of an inflation risk can it? I suspect that fears of inflation are overdone and commodity prices which are reacting to something else (call it perceived scarcity) are acting as a misaligned lighting rod for inflation fears.
We do think this cycle is entering a different, better, growth phase globally, but we do not think inflation is much of a threat. We think this confusion will however drive prices and bond yields quite possibly too far ahead whatever risks may emerge.
| Look at Global and Euro Liquidity Trends | |||||||
|---|---|---|---|---|---|---|---|
| Saar-all | Euro Measures (E13): Money & Credit | G-10 Major Markets: Money | Memo | ||||
| €-Supply M2 | Credit:Resid | Loans | $US M2 | £UK M4 | ¥Jpn M2+Cds | OIL:WTI | |
| 3-MO | 3.1% | 0.1% | 0.7% | 0.4% | 33.8% | 1.6% | -10.3% |
| 6-MO | 0.6% | -0.2% | -0.1% | 2.5% | 21.1% | 2.4% | 14.3% |
| 12-MO | 1.4% | -0.2% | -0.8% | 2.1% | 11.0% | 2.7% | 94.7% |
| 2Yr | 4.7% | 3.0% | 1.9% | 5.7% | 14.3% | 2.4% | -10.4% |
| 3Yr | 6.9% | 6.4% | 4.9% | 6.1% | 13.4% | 2.4% | 8.8% |
| Real Balances: deflated by Own CPI. Oil deflated by US CPI | |||||||
| 3-MO | 1.9% | -1.2% | -0.5% | -0.9% | 27.3% | 0.8% | -11.5% |
| 6-MO | -0.8% | -1.6% | -1.5% | 0.6% | 16.4% | 2.4% | 12.2% |
| 12-MO | 0.5% | -1.1% | -1.7% | -0.1% | 7.7% | 3.9% | 90.5% |
| 2Yr | 3.6% | 2.0% | 0.9% | 4.5% | 10.9% | 3.0% | -11.5% |
| 3Yr | 5.0% | 4.6% | 3.1% | 3.9% | 10.3% | 2.4% | 6.5% |
| All figures are through February | |||||||

Robert Brusca
AuthorMore in Author Profile »Robert A. Brusca is Chief Economist of Fact and Opinion Economics, a consulting firm he founded in Manhattan. He has been an economist on Wall Street for over 25 years. He has visited central banking and large institutional clients in over 30 countries in his career as an economist. Mr. Brusca was a Divisional Research Chief at the Federal Reserve Bank of NY (Chief of the International Financial markets Division), a Fed Watcher at Irving Trust and Chief Economist at Nikko Securities International. He is widely quoted and appears in various media. Mr. Brusca holds an MA and Ph.D. in economics from Michigan State University and a BA in Economics from the University of Michigan. His research pursues his strong interests in non aligned policy economics as well as international economics. FAO Economics’ research targets investors to assist them in making better investment decisions in stocks, bonds and in a variety of international assets. The company does not manage money and has no conflicts in giving economic advice.
More Economy in Brief
 Global| Feb 05 2026
Charts of the Week: Balanced Policy, Resilient Data and AI Narratives
by:Andrew Cates