 Global| Jan 21 2008
More Evidence of Weakness in U.K.Housing Market
Summary
The Building Societies Association (BSA), which covers all 60 Building Societies in the UK, approved mortgages amounting to 3,144 million pounds in December, down 26% from November of last year and 21% from December 2006. The broader, [...]
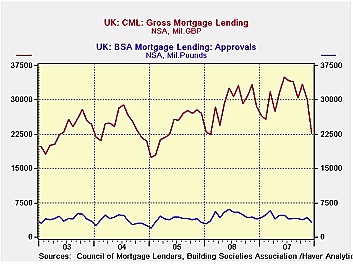
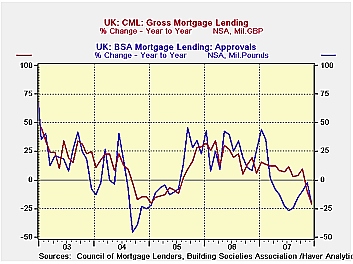
The Building Societies Association (BSA), which covers all 60 Building Societies in the UK, approved mortgages amounting to 3,144 million pounds in December, down 26% from November of last year and 21% from December 2006. The broader, Council of Mortgage Lenders (CML), which includes, in addition to the Building Societies, banks and other institutions engaged in mortgage lending, declined 25% in December from November and 21% from December 2006.
The first chart shows the absolute value of the approvals made by the BSA and total lending made by the CML. Over the past five years, approvals by the BSA have been between 11% and 22% of total mortgage lending. The second chart shows the year to year changes in the two series. The variation in the BSA data appears to be somewhat greater than that in the CML data.
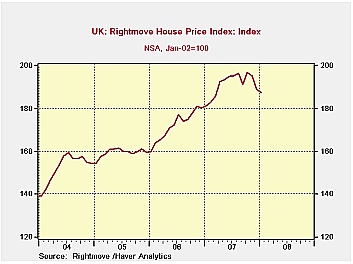
The Rightmove Price index declined by almost 1% in January and is now 4.6% below the peak reached in October of last year. The Rightmove Price Index is a measure of the asking price of houses coming to market through Rightmove's 11,500 estate agency branches. The sample includes up to 200,000 houses each month, representing about 80% of the market. It is the largest and most up to date sample of any house price indicator in the U.K.
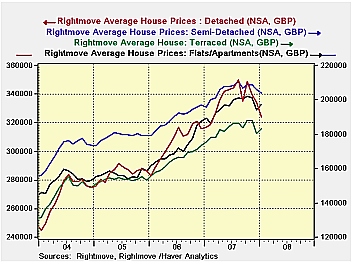
Rightmove also publishes the actual prices of various types of houses: detached, semi detached, terraced and flats. These are shown in the fourth chart. The prices of the more expensive accommodations--the detached and semi detached houses--fell, respectively, 3% and almost 1% in January. At the same time, the prices of the less expensive accommodations--terraced houses and flats rose, respectively, 1.7% and 1.8%.
| MORTGAGE AND PRICE DATA | Dec 07 | Nov 07 | Dec 06 | M/M %Chg | Y/Y %Chg | 2007 | 2006 | 2005 |
|---|---|---|---|---|---|---|---|---|
| Approvals by BSA (Million Pounds) | 3144 | 4238 | 3962 | -25.81 | -20.65 | 51739 | 56465 | 45628 |
| Lending by CML (Million Pounds) | 22600 | 29990 | 28617 | -24.64 | -21.03 | 362314 | 345217 | 288400 |
| Jan 08 | Dec 07 | Jan 07 | M/M %Chg | Y/Y %Chg | 2007 | 2006 | 2005 | |
| Rightmove House Price Index (2000=100) | 187.5 | 189.1 | 181.3 | -0.85 | 3.42 | 191.2 | 172.0 | 159.4 |
| Rightmove Prices of Houses (Pounds) | ||||||||
| Detached | 324114 | 334039 | 316739 | -2.97 | 2.33 | 336294 | 306255 | 284840 |
| Semi Detached | 203951 | 205759 | 195564 | -0.88 | 4.29 | 205645 | 189.353 | 178630 |
| Terraced | 183324 | 180224 | 175339 | 1.72 | 4.55 | 183681 | 164884 | 153475 |
| Flats/Apartments | 197384 | 193973 | 189265 | 1.76 | 4.29 | 196167 | 171504 | 156489 |
by Robert Brusca January 21, 2008
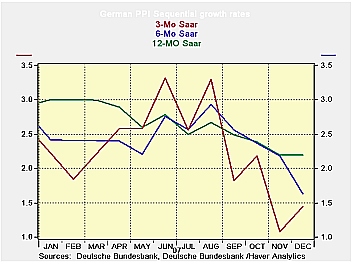
The German PPI was flat in December after a 0.9% surge in November. The ex energy PPI rose by 0.1% after rising by 0.1% in November and by 0.2% in October. No sign of second round effects here.
While the EBC is worried about building pressures in the monetary union this evidence of a break in inflation in Germany at the PPI level is good news. It is not surprising that the PPI, an index that should be more susceptible to the impact of the strong euro, is staying in line even with the reverberations of the spiking oil prices vibrating through it. The news is good news but it is not decisive. The price indexes that the ECB cares most about are the broader ones, especially the HICP. But this news is at least hopeful on the inflation front and good news there has been lacking lately.
| Germany PPI | |||||||
|---|---|---|---|---|---|---|---|
| %m/m | %-SAAR | ||||||
| Dec-07 | Nov-07 | Oct-07 | 3-mo | 6-mo | 12-mo | 12-moY-Ago | |
| MFG | 0.0% | 0.9% | 0.3% | 5.1% | 2.9% | 2.5% | 4.3% |
| Ex Energy | 0.1% | 0.1% | 0.2% | 1.4% | 1.6% | 2.2% | 2.9% |
More Economy in Brief
 Global| Feb 05 2026
Charts of the Week: Balanced Policy, Resilient Data and AI Narratives
by:Andrew Cates


