 Global| Aug 20 2008
Mortgage Applications Edge Lower; Credit Spreads Evince High Risk
Summary
Mortgage applications fell 1.5% in the week ended August 15, following a like decline the week before, together basically erasing a 2.8% increase in the August 1 week. This "Market Composite Index" stood at 419.3 in the latest week, [...]
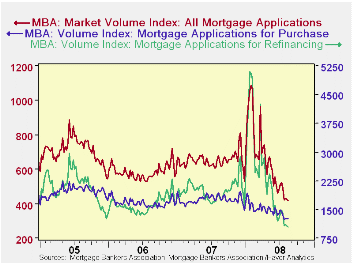
Mortgage applications fell 1.5% in the week ended August 15,
following a like decline the week before, together basically erasing a
2.8% increase in the August 1 week. This "Market Composite Index" stood
at 419.3 in the latest week, where the number of applications on March
16, 1990 is set equal to 100; this is down 34.6% from a year ago.
Applications for loans to purchase houses edged down 0.4% in the week
and are off 8.4% from July's weekly average and 28.9% from the year
earlier; those to refinance old loans decreased 3.7% to 1034.5, down
22.2% from July and 42.7% below a year ago.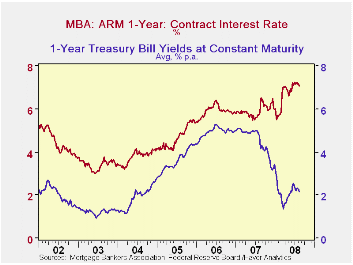
These data from the Mortgage Bankers Association are included in Haver's SURVEYW database. Other analytical information in this application survey tells that refinancing presently constitutes only 34.8% of the number of applications and 32.4% of their dollar value.
The mortgage interest rate situation is also notable. With the
turmoil among Fannie Mae, Freddie Mac and originating lenders and
rising delinquencies by borrowers, credit spreads remain wide
throughout financial markets, keeping interest rates elevated on all
but short-term, highly liquid debt. The most dramatic illustration in
these MBA data comes from the 1-year ARM rate versus the 1-year
Treasury. The ARM rate itself was 7.07% last week, higher than the
fixed rate on 30-year mortgages, 6.47%. The spread on the ARM over the
1-year constant maturity Treasury was 4.89%; the spread of the 30-year
mortgage over the 10-year Treasury was 2.56%. For the vast majority of
the history of these MBA mortgage rate series (since 1990), the spread
was larger for the longer-term rates, as one might intuit. But since
last August, this relationship, along with many other risk measures,
has been turned on its head, and sharply so. There is today far more
perceived risk in short-term mortgage instruments than long-term.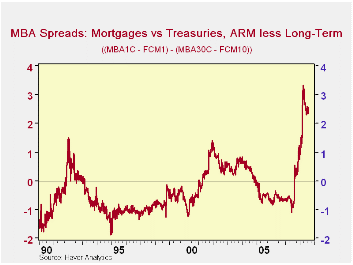
| MBA Mortgage Applications (3/16/90=100) | 08/15/08 | 08/08/08 | Y/Y | 2007 | 2006 | 2005 |
|---|---|---|---|---|---|---|
| Total Market Index | 419.3 | 425.9 | -34.6% | 652.6 | 584.2 | 708.6 |
| Purchase | 314.0 | 315.2 | -28.9% | 424.9 | 406.9 | 470.9 |
| Refinancing | 1,034.5 | 1,074.6 | -42.7% | 1,997.9 | 1,634.0 | 2,092.3 |
by Carol Stone August 20, 2008
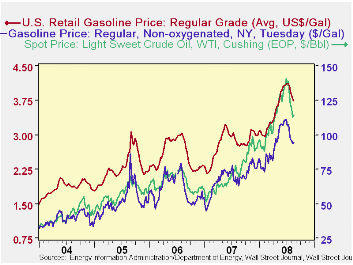
The recent price declines in oil and other energy products
have been noticeable (see graph) and welcome, giving evident support to
the stock market and consumer sentiment. In the U.S., the moving force
in petroleum prices has been demand, highlighted in the table below.
The Energy Department's "Weekly Petroleum Status Report", released
around mid-day every Wednesday, began to draw attention with weaker
usage figures in early- to mid-July, a period when gasoline consumption
normally increases. The lower numbers for "product supplied" were
mirrored in higher levels of gasoline and crude oil inventories, again,
not a normal development for the height of the summer-vacation driving
season.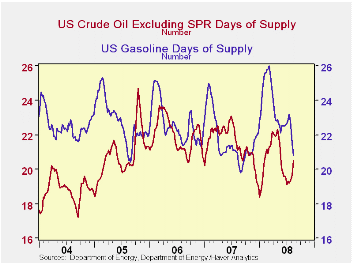
A summary of these demand and inventory developments can be
seen in the second graph here, the "Days of Supply" data, an
"inventory/sales" ratio for this industry. Inventories averaged over
the last four weeks are divided by "product supplied" for gasoline or
by crude oil input to refineries. The numbers out today for the period
ended August 15 show gasoline inventories at 20.8 days of gasoline
demand. This is down from 21.5 days last week, but still above 20.4
days a year ago. Crude oil supply stands at 20.5 days, up from 19.7
days last week. This supply figure is below the year-ago at 21.2, but
compares favorably to 19.1 days at the beginning of July, about when
demand weakness began to predominate.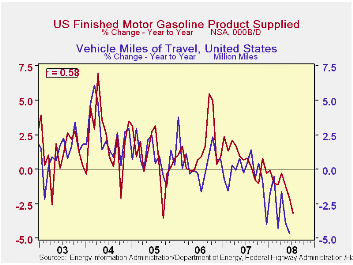
Lower demand, especially for gasoline, can come from more efficient vehicles, more of which are appearing on the roadways. But the most fundamental cause of less gasoline consumption is less driving. Miles driven began to sink below year-earlier levels late in 2007 and have had a negative comparison in nine of the last 10 months; the third graph here shows a 58% correlation between the year-to-year changes in vehicle miles of travel and gasoline product supplied since 2003. Other periods of such driving behavior occurred in 1973 and 1979, also times of energy crisis and surging prices. They were short-lived, however, and driving picked right up again when price and supply constraints eased. We have the impression that consumers realize more of the connection between their driving and the price of gasoline, so it will be interesting to see if they keep to their new behavior over a sustained period.
| U.S. Oil Demand (000 b/d) | 08/15/08 | 08/08/08 | July 2008 | June 2008 | 2007 | 2006 | 2005 |
|---|---|---|---|---|---|---|---|
| Total Product Supplied | 20,106 | 20,372 | 20,156 | 20,342 | 20,901 | 20,829 | 20,702 |
| Yr/yr % Chg | -5.6 | -3.6 | -3.2 | -2.1 | 0.5 | 0.6 | 1.7 |
| Finished Gasoline | 9,423 | 9,446 | 9,375 | 9,338 | 9,356 | 9,284 | 9,153 |
| Yr/yr % Chg | -3.5 | -1.3 | -4.0 | -2.4 | 0.8 | 1.4 | 0.9 |
by Robert Brusca August 20, 2008
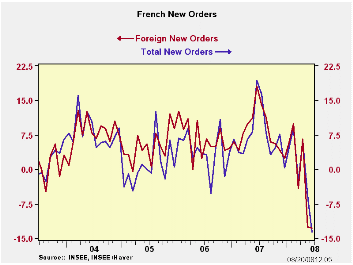
French orders edged higher in June as weak domestic orders were offset by strong foreign orders. Foreign orders were by a robust 2.6% m/m in June. Still for the full quarter orders are falling. Total orders are off at an11.3% annual rate in Q2 and foreign orders are off at an 18.6% annual rate.
The sequential growth rates for orders do not show a cumulating deterioration. Sequential order weakness has dissipated over the more recent periods – except for the Q/Q growth rate. Yr/Yr growth is -12.1% compared to -2.5% over three months. The same sort of pattern emerges for foreign orders. Despite the order rise in June trends still look quite negative. The month’s rebound follows sharp declines in May. French orders have been very choppy.
| French Orders | |||||||
|---|---|---|---|---|---|---|---|
| SAAR except m/m | Jun-08 | May-08 | Apr-08 | 3-mo | 6-mo | 12-mo | Quarter-2-Date |
| Total | 0.1% | -6.3% | 5.9% | -2.5% | -4.0% | -12.1% | -11.3% |
| Foreign | 2.6% | -10.4% | 6.6% | -7.9% | -10.3% | -11.4% | -18.6% |
by Robert Brusca August 20, 2008
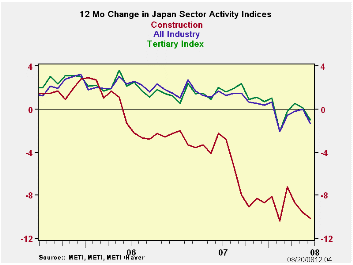
The all industries index dropped in June, its first drop in four months. The index still stands in the 88th percentile (top 12 percent) of its range. Construction fell again dropping to the bottom of its range. The all important tertiary (or services) index is in the 92nd percentile of its range. It has fallen in four of the past seven months and in each of the past two.
The construction index has been weak for some time. The tertiary and overall indices are weakening for the second time since early in 2008. The tertiary sector is where most of the jobs are.
| Up-to-date Japan Industry Surveys | |||||||||
|---|---|---|---|---|---|---|---|---|---|
| Recent Months | Moving Averages | Extremes; Range | |||||||
| Jun 08 | May 08 | Apr 08 | 3-Mo | 6-Mo | 12-Mo | Max | Min | %-Tile | |
| All Industry | 106.5 | 107.5 | 107.1 | 107.0 | 106.8 | 107.1 | 108.1 | 93.8 | 88.8% |
| Construction | 69.9 | 70.5 | 71.8 | 70.7 | 71.3 | 72.5 | 122.9 | 69.9 | 0.0% |
| Tertiary | 109.5 | 110.4 | 110.6 | 110.2 | 109.6 | 110.0 | 110.9 | 92.0 | 92.6% |
| Ranges, Max, Min since 1993 | |||||||||
Carol Stone, CBE
AuthorMore in Author Profile »Carol Stone, CBE came to Haver Analytics in 2003 following more than 35 years as a financial market economist at major Wall Street financial institutions, most especially Merrill Lynch and Nomura Securities. She had broad experience in analysis and forecasting of flow-of-funds accounts, the federal budget and Federal Reserve operations. At Nomura Securities, among other duties, she developed various indicator forecasting tools and edited a daily global publication produced in London and New York for readers in Tokyo. At Haver Analytics, Carol was a member of the Research Department, aiding database managers with research and documentation efforts, as well as posting commentary on select economic reports. In addition, she conducted Ways-of-the-World, a blog on economic issues for an Episcopal-Church-affiliated website, The Geranium Farm. During her career, Carol served as an officer of the Money Marketeers and the Downtown Economists Club. She had a PhD from NYU's Stern School of Business. She lived in Brooklyn, New York, and had a weekend home on Long Island.


