 Global| Apr 23 2020
New Home Sales Fall in March; More Drops Likely Ahead
Summary
• New single-family dropped 15.4% in March to 627,000 with meaningful downward revisions to January and February. • Despite the weakness in March and downward revisions, sales remain elevated relative to recent history. • [...]
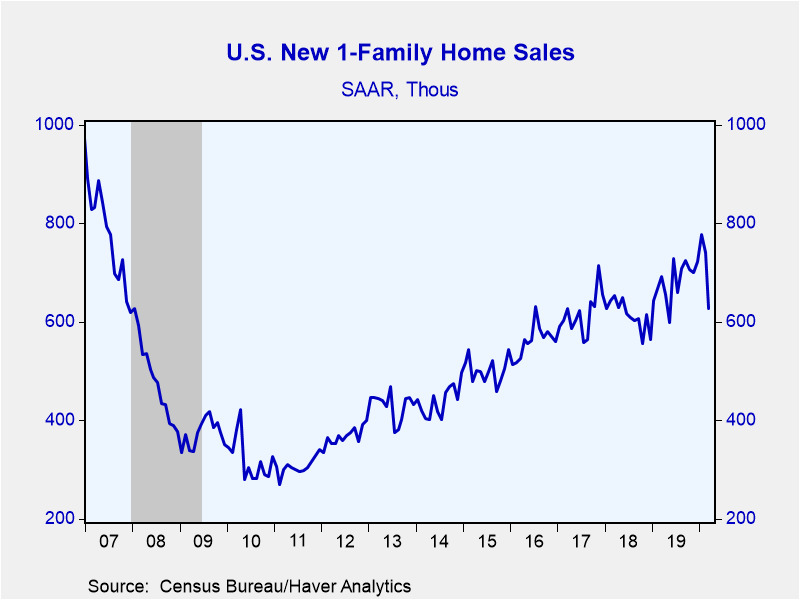
• New single-family dropped 15.4% in March to 627,000 with meaningful downward revisions to January and February.
• Despite the weakness in March and downward revisions, sales remain elevated relative to recent history.
• Unfortunately, indications such as a mortgage loan applications suggest this will not remain the case going forward.
Sales of new single-family homes plummeted 15.4% in March to 627,000 units at a seasonally adjusted annual rate (-9.5% year-on-year). The Action Economics survey had expected sales of 650,000 in March. The prior two months were revised meaningfully lower. February sales were down to 741,000 from 765,000 while January is now 777,000; it was 800,000. Despite the weakness in March and downward revisions, sales remain elevated relative to recent history. Sales in March were above the May 2019 level and sales averaged 715,000 in the first quarter of this year, slightly higher than the 710,000 in 2019Q4. Unfortunately, indications such as the over 30% y/y drop in the Mortgage Bankers Association index of loan applications for home purchase in the first three weeks of April, suggest substantial weakness going forward.
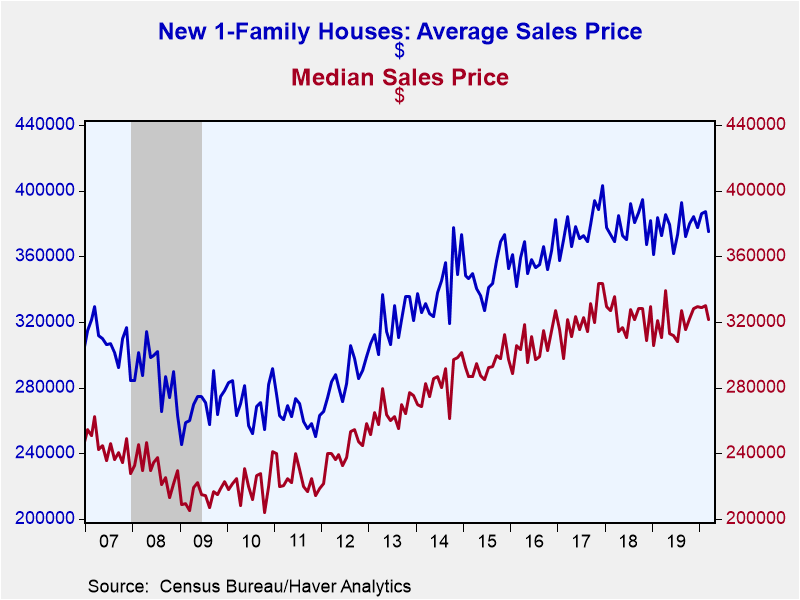
The median price of a new home declined to $321,400 in March (+3.5% y/y). The average price of a new home decreased to $375,300 (+0.7% y/y). Home prices, which are not seasonally adjusted, have been rangebound for the last few years.
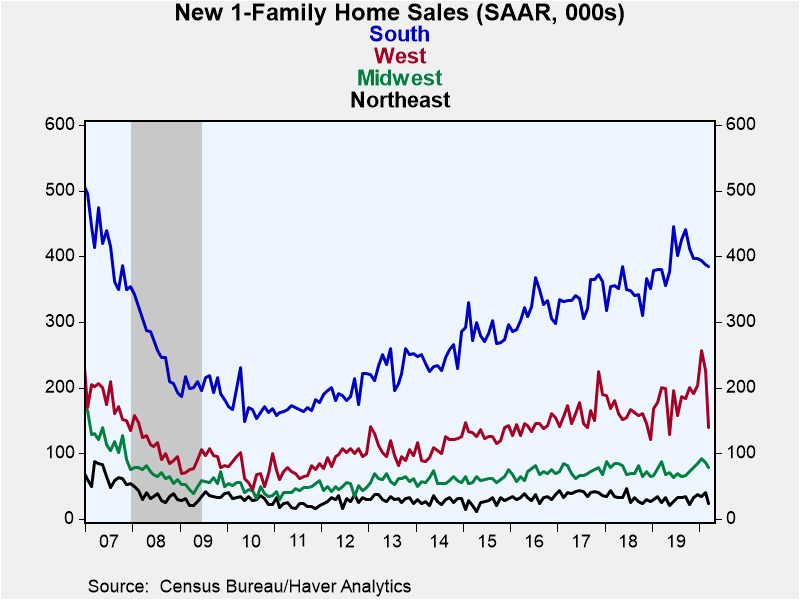
Sales activity declined in all regions the country in March, led by a 41% drop in the Northeast, followed by a 38% fall in the West. Meanwhile, the South -- the largest region, representing over 50% of sales -- only decreased 0.8%.
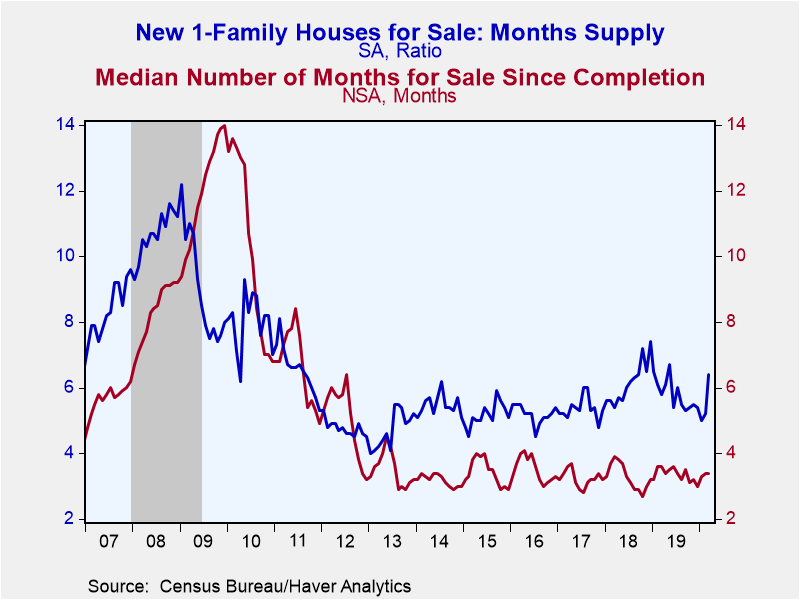
Another indicator of potential trouble ahead is the months' supply of homes on the market which increased to 6.4 months in March from 5.2 months in February. Still it is well below the eight-year high of 7.4 months seen in March 2018.
New home sales activity and prices are available in Haver's USECON database, while MBA loan applications can be found in SURVEYW. The consensus expectation figure from Action Economics is available in the AS1REPNA database.
| U.S. New Single-Family Home Sales (SAAR, 000s) | Mar | Feb | Jan | Mar Y/Y % | 2019 | 2018 | 2017 |
|---|---|---|---|---|---|---|---|
| Total | 627 | 741 | 777 | -9.5 | 684 | 615 | 617 |
| Northeast | 24 | 41 | 35 | -4.0 | 30 | 32 | 40 |
| Midwest | 79 | 86 | 92 | -9.2 | 72 | 75 | 72 |
| South | 385 | 388 | 393 | 1.3 | 399 | 348 | 341 |
| West | 139 | 226 | 257 | -30.8 | 183 | 160 | 164 |
| Median Price (NSA, $) | 321,400 | 330,100 | 328,900 | 3.5 | 321,500 | 326,400 | 323,100 |
Gerald D. Cohen
AuthorMore in Author Profile »Gerald Cohen provides strategic vision and leadership of the translational economic research and policy initiatives at the Kenan Institute of Private Enterprise.
He has worked in both the public and private sectors focusing on the intersection between financial markets and economic fundamentals. He was a Senior Economist at Haver Analytics from January 2019 to February 2021. During the Obama Administration Gerald was Deputy Assistant Secretary for Macroeconomic Analysis at the U.S. Department of Treasury where he helped formulate and evaluate the impact of policy proposals on the U.S. economy. Prior to Treasury, he co-managed a global macro fund at Ziff Brothers Investments.
Gerald holds a bachelor’s of science from the Massachusetts Institute of Technology and a Ph.D. in Economics from Harvard University and is a contributing author to 30-Second Money as well as a co-author of Political Cycles and the Macroeconomy.
More Economy in Brief
 Global| Feb 05 2026
Charts of the Week: Balanced Policy, Resilient Data and AI Narratives
by:Andrew Cates


